User stories or scenarios are the suggested and preferred way for most agile development teams to capture software features in bite-sized morsels. It helps to continuously focus on the feature from end-user perspective (targets user-experience, persona) and the situation (i.e. the need for that feature) and expected behavior (i.e. what the user is trying to […]
Category: STEM
Analyses of Critical Words & Speeches!
In one of my earlier blogs, I shared the techniques and code to create Word Cloud using Python and Excel together in this article: Word Cloud III – Python & Excel Together Today, building on that, I’ll analyze some of the most historic speeches and/or documents that every kid should read and even memorize part […]
vCards to/from CSV/Excel (and more)
vCards. What are they? Here’s a blurb from wikipedia:vCard, also known as VCF, is a file format standard for electronic business cards. vCards are often attached to e-mail messages but can be exchanged in other ways, such as Multimedia Messaging Service, on the World Wide Web, instant messaging or through QR code. They can contain […]
Using Directions & Travel APIs With Excel, Python. 2/2
This is the second part of the getting directions and travel info using Bing Maps. The first part shows how to do it in Python (check it out here), and in this part, I’ll share some tips on how to get the same info from within Excel without writing any VBA code! To get the […]
Using Directions & Travel APIs with Excel, Python. 1/2
In this blog, I’ll share tips on how to consume RESTful APIs for maps. Specifically, getting a location point info, getting distance and travel times between two points, and even turn-by-turn driving directions. With the techniques, we can also get walking and transit mode of travel info. I’ll be leveraging Bing Maps APIs as they’re […]
Decomposing data in PowerBI
A decomposition tree visual or a widget is very helpful in understanding cause and effect of data. It gives an easy-to-view insight to the underlying data. Suppose we have a fact table of raw data of products sold, revenue, place and time of sale, etc. etc. etc. Every month, year, product, country repeat as they […]
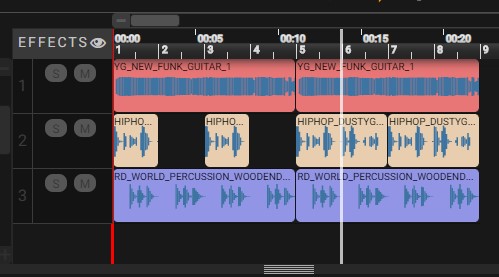
Music Mixing with Python
Recently, I accidently encountered a new online service called EarSketch for music creation and mixing using Python. I had to of course check it out in more detail and was very impressed with the simplicity and effort put into the overall UI, API, and technical documentation. They are definitely worth checking out! Kudos to EarSketch […]
Putting together our Presidents (Infographic in Excel)
In several of my earlier blogs, I demonstrated working with raw data from multiple sources to generate visual and statistical analysis. You can find them in the following posts: Let’s Play With All The Presidents (Excel)-Part1 Let’s Play With All The Presidents (Excel)-Part2 Getting To Know Our Presidents In this blog, I share the combined […]
When you’re going “blank”! (Excel, Python)
You have data (of course, you do) and you have data that have something missing (of course, you do). The question is multi-fold around that…do we ignore the data, do we remove them from your analysis, or do we interpolate to fill in the missing data? And if so, what type of interpolation is best? […]
Word Cloud III – Python & Excel together
In two my earlier blogs, I shared two methods & codes in Excel and Python on how to create Word Clouds from any text or document. You can find them here: How To Find The Most Occurring Words In A Document? (python) and Creating Word Cloud Accurately And Easily In Excel (Excel) Now, I’ll turn […]