If you’ve worked with Visio or PowerPoint, you may have used their built-in organizational charts…and manually enter the information for each node. But what if you have the data already as a table, as in a CSV or Excel file? You can use that data and create an organizaitonal chart right within Excel. However, you’ll […]
Blog
Text-to-Speech (TTS) and Pandas (POTUS data)
In this post, I introduce you to my Python 3.x program that reads an external data file containing all president names of the USA to-date (2022), and that allows users to enter a query to and hear the names of presidents as the result. The query can be a number such as a first N […]
A Curious, Remarkable Artist’s Profile: Wain
Louis William Wain (5 August 1860 – 4 July 1939) was an English artist best known for his drawings, which consistently featured anthropomorphized large-eyed cats and kittens. Later in life, he was confined to mental institutions and was alleged to have suffered from schizophrenia. According to some psychiatrists, the onset of schizophrenia can be seen […]
Working with 2D Arrays in Python and Graphics
In this post, I’ll share tips on how to create a 2D array and map it to a visual grid to depict it using Python. 2D arrays (or 2D lists as they’re called in Python) are fundamental to any programming language and tackling them requires understanding language-specific syntax, however, the core concepts are the same […]
Blackjack game (player vs. dealer: 1vCPU)
This is a one-player Blackjack game (playing against a non-human Dealer) simulating common rules of Casino Blackjack in the USA. The code is shared under the licensing term as listed. This is all Python 3.x code and has been tested on Windows although it should work on other platforms. It can also be made into […]
Car simulation and analytics. OOP in Python
In this post, I share a program that is built with an object-oriented design from the ground up in Python. It’s a game or simulation if you will, but has all the plumbing necessary to make it fancier, and a 2D or even a 3D game. It works as follows:You create a car object. Then […]
Etch-a-sketch using Pygame
In one of my past posts, I demonstrated an Etch-a-sketch program using Python’s Turtle library. In this post, I demonstrate writing a similar app using pygame library with new twists. The idea is similar…you use up/down/right/left arrow keys on your keyboard to move the drawing cursor…however, you can also press up+right to make it go […]
True text transformation without using any special libraries (Python)
In this post, I’ll share a real example (and an application that you can download and use for your personal use) on how to turn text into fun representation such as: flipped, reversed, substituted with other characters using Python. The output is not an image, but still real text that are not easily accessible from […]
Geometric Shapes with Tkinter & Turtle
In this post, I’m sharing a complete Python program that draws various geometric shapes on screen with given parameters (e.g. side length, radius, height, tilt, etc.). The application is downloadable here and can be executed on a Windows device (tested on Windows 10). The download will be a ZIP file called tkinter-drawgeometricshapes.zip —copy or unzip […]
Venn Diagrams Done Right (Excel)
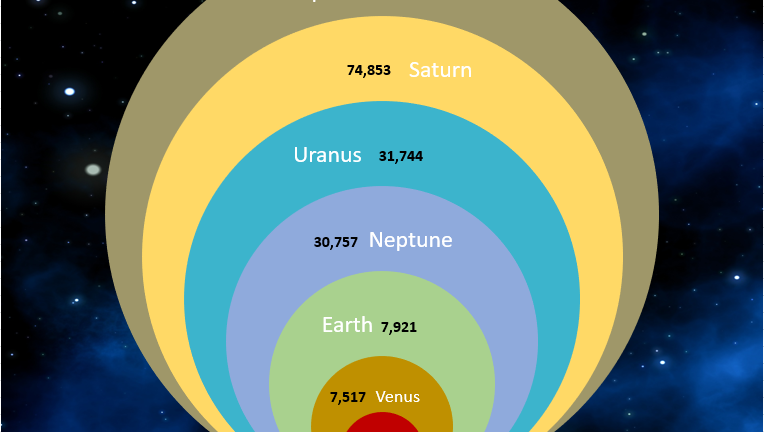
Venn diagrams are best used to show overlapping or interconnected relationships, especially overlapping segments. While they are ubiquitous, very few diagrams actually update automatically when data changes…that’s because most of them are one-time illustrations with no ties to the underlying data…they’re just drawn up like Infographics. It doesn’t have to be that way! In this […]