I’ll start with a simple dataset and demonstrate how many critical questions can arise just from this. You can now imagine in a real-world situation, how many more complex questions can be asked and information gleaned! But if we can’t extract the key answers from this table, we won’t be able to tackle even the simplest queries in a dataset that’s complex and huge. So, let’s get started with the foundation.
First, we have this simple dataset. Let’s assume it’s laid out as below (the solutions/formulas will refer to this grid for convenience of the reader):
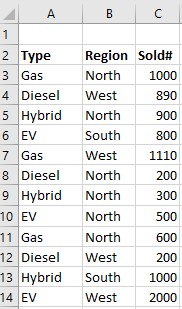
As the head of multiple dealerships across several regions, you want to get some key information and therefore, you set out the objectives as below:
- Show total units sold by vehicle type.
- Show types of vehicles that sold 1,000 or more units across all regions.
- How many vehicles sold 1,000 or more units (any type)?
- Show Vehicle types sold by Region: Total and Average.
- Show vehicle types sold by Region, Type and Totals for each type. Make it interactive so that you can slice/dice different ways.
So, let’s get you the answers! There are alternate ways of achieving the same outputs, I’m showing you my preferred ways in this blog.
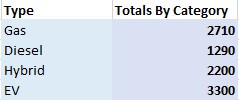
For #1: Show total units sold by vehicle type.
We want to get the sum of all counts from column C but categorized by Type as in column A. Let’s also assume that you have the unique Type labels in the following cells (I’ll also show you how to do these without cell references in formulas below):
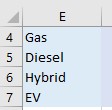 Then the formula that’ll give us the answer for “Gas” type is =SUMIF($A$3:$A$14,E4,$C$3:$C$14)
Then, for the rest of the types, increment the 2nd parameter (e.g. E5…E7).
And the complete result is below:
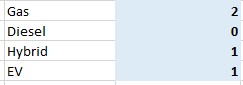
For #2: Show types of vehicles that sold 1,000 or more units across all regions.
Now we have a new criteria (1000 or more) that we have to incorporate. So, let me introduce COUNTIFS which will do the job easily. The formula is =COUNTIFS($A$3:$A$14,”Gas”,$C$3:$C$14, “>=1000”)
You’ll change the 2nd parameter to match the type values for the rest of the type, or you could just use cell references. Same idea with the 4th parameter…whichever makes sense for your criteria.
The answer is:
For #3: How many vehicles sold 1,000 or more units (any type)?
Here we just want to get the counts from column C, where any value was >=1000 regardless of type. In fact, the formula is simpler than the question: =COUNTIF($C$3:$C$14, “>=1000”)
The answer: 4
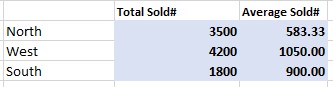
For #4: Show Vehicle types sold by Region: Total and Average.
Let’s start with North, and find its total sold units. The formula is: =SUMIF($B$3:$B$14,”North”,$C$3:$C$14)
To find the average, of course we can simply divide the total by the number of instances that matched the criteria for the total. So, the above output could be simply divided by the output of COUNTIF($B$3:$B$14,”North”)
Or, =F24/COUNTIF($B$3:$B$14,”North”) assuming that the total is in cell F24.
Or, instead of depending on the previous cell, we can get the average in one shot from the dataset by this: =(SUMIF($B$3:$B$14,”North”,$C$3:$C$14))/(COUNTIF($B$3:$B$14,”North”))
And the output is:
For #5: Show vehicle types sold by Region, Type and Totals for each type. Make it interactive so that you can slice/dice different ways.
This is best accomplished by a Pivot in my opinion. Sure, you could force yourself to not use the powerful pivot features, but why? Who’s making you?
Let’s choose the dataset and insert a new Pivot table (same sheet or another, your choice). Once the blank pivot control is inserted, click on it to bring up its fields and choose this set up:
For rows, choose Region, Type. And for Values, choose Sold# (which will be calculated as Sum by default). And now you have the results:
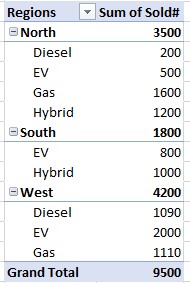
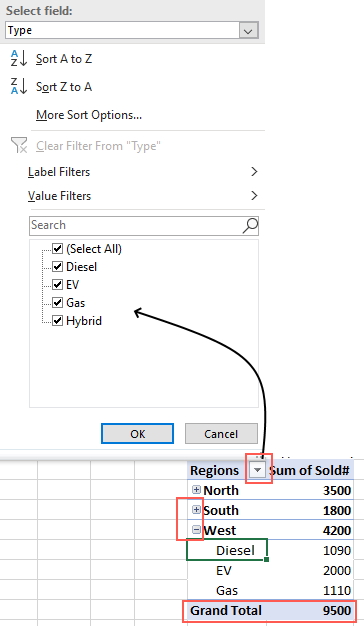
Now that this table is generated, using the drop-down from Regions column, we can un/select any region we wish (I renamed the column to Region for brevity), and the table is updated accordingly along with Grand Total in real-time. We can also expand/collapse each region; when collapsed, the totals are shown for all vehicle types, and when expanded totals for each type is shown individually.
So there you have it…all questions answered. Elegantly, accurately.