Let’s say that we have a sequence of numbers in consisting of whole numbers, fractions, positive and negative numbers of varying length, that is, of no predefined length (e.g.2.25, 5.25, 6.75, 8.25, 9.75…). What we want to do is to sort the numbers in ascending order, and find the differences between 2 adjacent numbers and find the minimum and maximum differences between them. Then show each pair of numbers with miminum and maximum differences (distances) in a plot. This helps identify the outliers easily from a sequence of numbers and can have various practical applications.
To put a bow on this little project, I want to show the line segment with largest difference in red;
and show the line segment with shortest difference in green on the same plot!
This post contains the application in a widget format so you can run it on this page without downloading anything. This is implemented in Python.
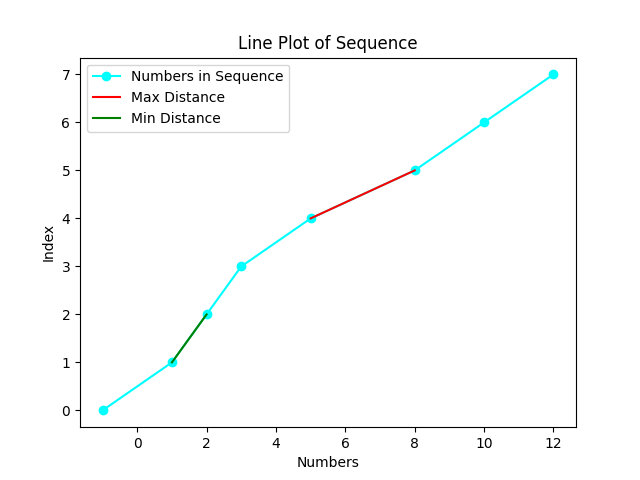
Below is an example session and outputs of the sequence of numbers input: 2,5,8,1,3,10,12,-1
And the corresponding plot generated is below with the minimum segment (between 1,2) plotted as green, and the maximum segment (between 5 and 8) plotted as red (the input values are in X-axis sorted in ascending order)
Enter a sequence of numbers separated by commas (e.g., 3,-8,3,5.5 and so on. Don't worry about the order, I will sort it): 2,5,8,1,3,10,12,-1
Sorted list: [-1.0, 1.0, 2.0, 3.0, 5.0, 8.0, 10.0, 12.0]
Minimum difference: 1.00 (between 1.00 and 2.00)
Maximum difference: 3.00 (between 5.00 and 8.00)
You can try it out below by running the program right on this page. Click ![]() in the widget below to run the program and enter your sequence of numbers. The minimum, maximum points and the plot will appear after you enter the sequence (Enter key on your keyboard).
in the widget below to run the program and enter your sequence of numbers. The minimum, maximum points and the plot will appear after you enter the sequence (Enter key on your keyboard).
Overview of the underlying code
First we read the input from user (comma-separated), split them into individual numbers. Then convert the them into float and store in a list.
Then sort it and store in a new sorted list: sorted_list.
Next, calculate the difference between values at index [i+1] and index [i] and repeat for the entire length of sorted list and store the differences in a new list called ‘diffs_list’.
Find the min, max using min(), max() in diffs_list.
We now can find the pairs of points where it’s max and min differences. That is:
farthest points will be: sorted_list[diffs_list.index(max_diff) and sorted_list[diffs_list.index(max_diff)+1
nearest points will be: sorted_list[diffs_list.index(min_diff) and sorted_list[diffs_list.index(min_diff)+1
Do this to get min and max distance point pairs separately.
Finally, we plot the chart using matplotlib library.
We plot the chart using matplotlib. A line is drawn between the nearest points in green, and again another line is drawn between farthest points in red.
You may also like:
Calculating Euclidean Distance In Python
Finding A Missing Number In A Sequence
▛Interested in creating programmable, cool electronic gadgets? Give my newest book on Arduino a try: Hello Arduino!
▟