In this post, I share my design and code for simulating some propagating organisms (you can think of them as humans, other creatures, cells, objects, whatever you like) with certain rules. And although I have a couple of other variations of this made in C/C++ in the past, I wanted to do it in Python and add some new twists as well. This uses turtle library for the visuals and matplotlib for plotting.
My simulation design:
Create objects with these attributes: gender (int), species (int), intellect (int), vigor (int), age (int),
longevity (int). These objects will be individually created to create a desired starting population of n (say, 25) and they will be visually rendered on screen.
Each object at creation is assigned a random gender (0|1) along with other individual attributes such longevity (how long it will live), etc. and randomly placed on screen. If the gender is 0 (e.g. male), it’ll be a square; otherwise (1) it’ll be a circle (e.g. female).
Age at creation starts at 0. Each iteration, age increases by 1 until longevity, if age is greater than longevity, the object dies and also erased from the screen. If age range is between 16 and 40, AND there is another object within x distance (pixels for example), with a gender that is opposite then procreation happens — and a new object is created. The newbord is shown on screen and its age starts at 0.
Additionally, the color of each square (object) will be of certain color depending on its age range. Cyan for example when aged <16 and red when 16 to 40, and gray when age is within 20 from its longevity value (death age), otherwise (40 to longevity-20), it’ll be black. Think of gray color for seniors, cyan for minors, red for adults in their prime (breeding age), and black for older adults (past prime) but younger than seniors.
The newborns are shown as turtles initially, then in the next cycle, each gets its gender assigned (male/female). Then their shape will change accordingly — if male, shape=square; else shape=circle.
In parallel, as cycles continue, their ages progress (until they die…which is based on longevity attribute…which can be at very young age or very old age or in-between, which the computer decides randomly), and so their colors as explained above.
Finally, I want to tackle overpopulation in 2 stages: Over-population (e.g. when living population reaches 100+) and Extreme-over-population (when living population reaches 200+). These events are handled differently. During over-population period, procreation still occurs but the newborns’ longevity will be reduced to half as under normal conditions until population returns to normal, healthy level.. During extreme-over-population period, procreation will cease until population returns to normal, healthy level.
The simulation ends when there is not enough population to procreate anymore (remember, there must be at least 2 objects of opposite sex within x distance AND at breeding age to procreate AND when there is no extreme-population event), or when the user ends the simulation manually.
These are all rendered real-time on screen for visual reference. Once the simulation is ended by user or by the inadequate population event.
During the simulation, there is a running statistics display of the world. After the simulation ends, there is additional metrics on final absolute population change, and over percentage change of population (both take into accounts the birth rate and death rate over the periods). Optionally, it will also show a visual plot of some key trends over the period of simulation.
Calculating population change:
To calculate the population change rate I use the formula:
r = (P2-P1)/t where P2 is the final population, P1 is starting pop. t is the time interval (years, months, whatever). This is the absolute change in the number of individuals per year. e.g. if it is 2.9, then the population growth is 2.9 individuals per year (if t is in years).
To calculate the percentage change, divide the population change (P2-P1) by the initial population (P1) and multiply by 100. So if ending pop is 190 (P2) and starting pop was 20 (P1), then the population percentage change = 850%
Ok, now we have all the designs ready, it’s time to code! Good news is, I have already spent the time coding it and tweaking/fixing it until it is running properly.
Let’s look at some example simulation outputs first. Animation 1 shows a simulation on screen as it occurs real-time. This is for 22+ cycles (or years in simulation)…you notice how the minors are in cyan, and their shapes indicate their gender (square for male, circle for female), then they change colors as they age (they become red when in prime, black just past-prime, and gray when they are seniors). They disappear if they die (due to old age or due to short longevity set at birth). You will also notice some black turtle images appear when there were 2 objects of opposite shapes (gender) that were within 100 pixels to each other…these are the newborns and they appear at a new, random location on screen (not necessarily close to the parents). And so the cycle continues.
After running 22 cycles, the console stats output may look something like this:
|
1 2 3 4 5 6 7 8 9 10 11 12 |
Stats/Log after 23 cycles (years). Runtime: 2-3 mins. GENDER STAT: gender0 ♂: 50 | gender1 ♀: 40 LONGEVITY: Minimum longevity: 5 | Maximum longevity: 100 | Average longevity: 67.4 AGE STAT: Min age: 0 | Max age: 62 | Avg age: 21.1 >>> YEAR-END INFO: Year: 22 | Current Living Population: 81 | Total births: 65 | Total deaths: 9 ***** Child born! Gender: ♂ | lives until: 79 ***** Child born! Gender: ♂ | lives until: 79 ***** Child born! Gender: ♀ | lives until: 59 Population absolute change: 2.43 object per year Population percent change over 23 years: 224.0 % |
A plot drawn the program at end of 23 cycles looked like this (Figure 1):
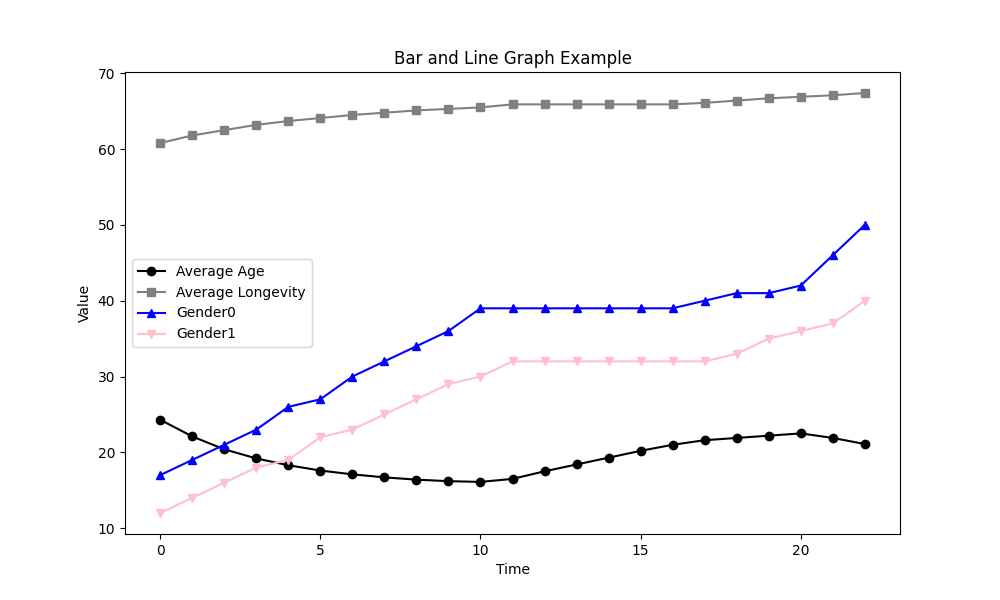
Between the console stats and the plot, we can get a very clear picture of the trend and the world we created.
I have run the simulation many times, and over 900 cycles (years) which translates to real-time 22 hours straight. Below are some outputs after 900 years!
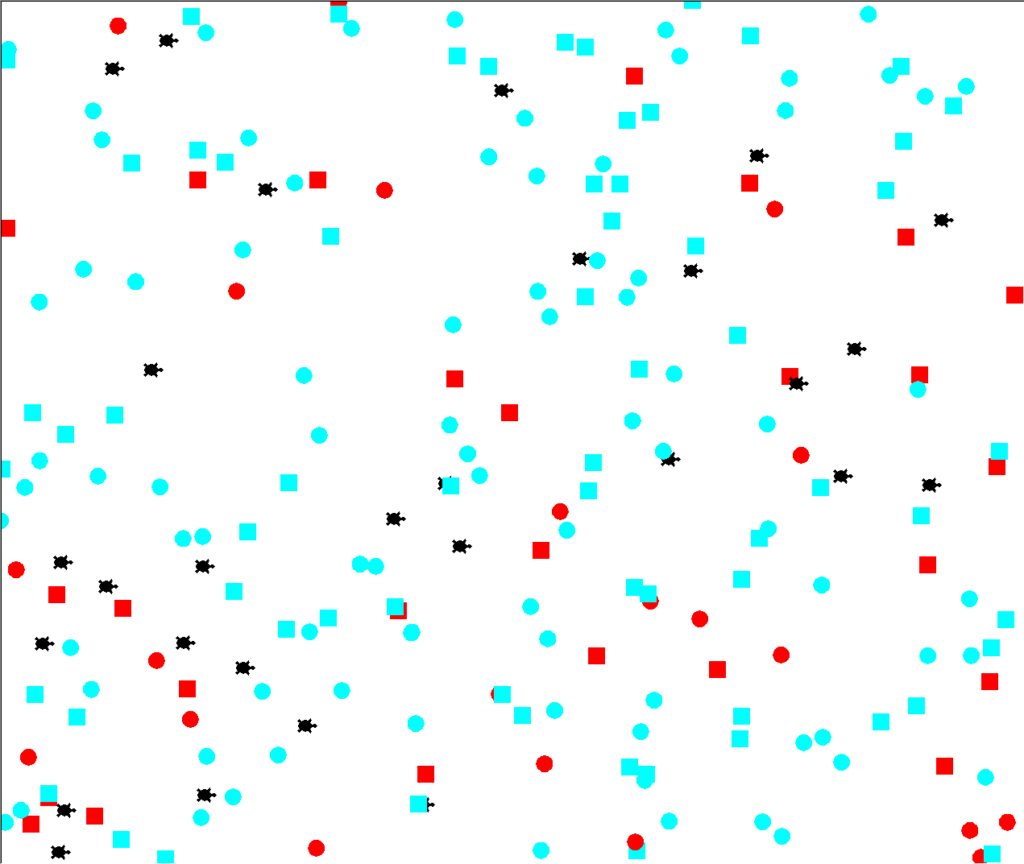
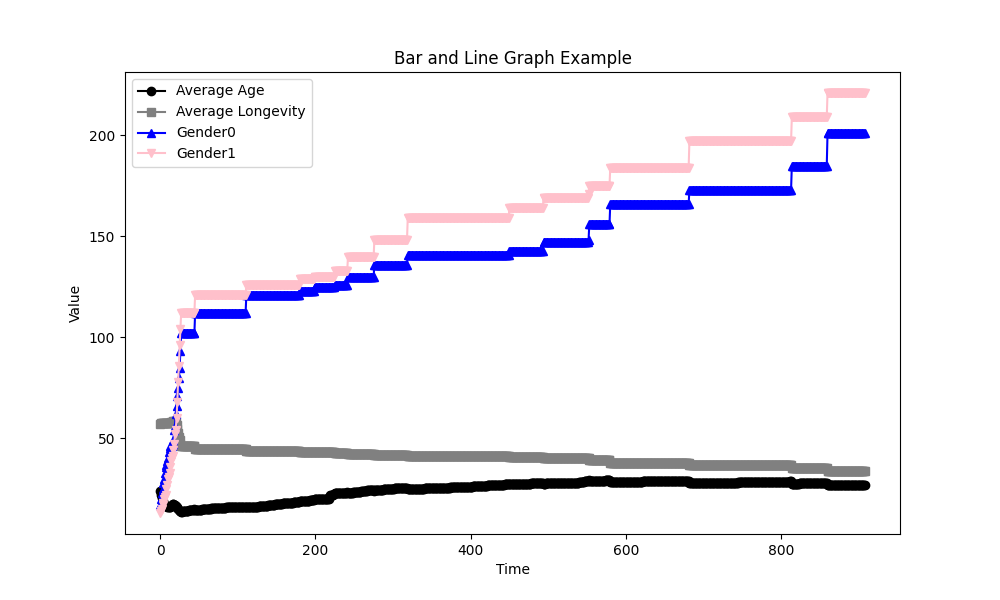
Figure 2 shows the population situation on screen after 900 years of sim. Figure 3 shows the plot with key metrics.
And below we can also see console output with some final stats.
|
1 2 3 4 5 6 7 8 9 10 |
GENDER STAT: gender0 ♂: 201 | gender1 ♀: 221 LONGEVITY: Minimum longevity: 8 | Maximum longevity: 96 | Average longevity: 33.8 AGE STAT: Min age: 0 | Max age: 97 | Avg age: 26.9 >>> YEAR-END INFO: Year: 899 | Current Living Population: 222 | Total births: 397 | Total deaths: 196 ! EXTREME OVER-POPULATION ! Procreation paused til less denisty. ! OVER-POPULATION ! Breeding pair found but newborn's longevity HALVED til less density. GENDER STAT: gender0 ♂: 201 | gender1 ♀: 221 LONGEVITY: Minimum longevity: 8 | Maximum longevity: 96 | Average longevity: 33.8 AGE STAT: Min age: 0 | Max age: 97 | Avg age: 26.9 >>> YEAR-END INFO: Year: 900 | Current Living Population: 222 | Total births: 397 | Total deaths: 196 |
As you can see there has been both an over-population and extreme-over-population event occurred, which affected the longevity and procreation rate (also clear in the plot). The gender lines are cumulative in the plot (not just of living ones only but genders of all new births during the sim). As an exercise, you may want to display just the living population objects by gender.
You will not get the full effect until you run the code locally on your machine, but I can try to emulate the simulation below by embedding the core parts of the code. (Note that the simulation will be much smaller than running on a local machine which will scale the sim window much larger for better viewing, but that is not possible to embed here on a web page).
My complete code is shown below — there are a few things I have left in code for future extension but the design explained here is fully implemented in this version. If you reuse the code for educational purposes, be sure to credit (Author: Tony Rahman of Flyingsalmon.net). Note that reselling or reusing the core code or design for any commercial purposes is forbidden.
Click Play button ![]() below to start your simulation on this page. Click Stop button
below to start your simulation on this page. Click Stop button ![]() to stop the simulation anytime.
to stop the simulation anytime.
I hope you found this post interesting and inspiring. What world will you create?