Reminiscing the old tank game, I wanted to re-create a low-weight, low-code option of that simulation. The game depended on a canon (projectile) shot at your selected speed and angle to hit an enemy tank. The foundational formula is used in missile launch, sports, and many (you guessed it) military applications.
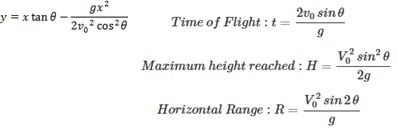
Here, using the same formula (for simplicity, we won’t count air resistance for this exercise, although it can be done just the same with additional parameters), we will generate the coordinates of the projectile based on initial velocity and angle of release. Let’s first get the formulas down:

Pretty straightforward. So, we can calculate at any given point of time, the distance (x) and elevation (y). Additionally, we can find out how long the projectile actually in the air (time of flight), its range (max distance), and its potential max height (altitude). This is math…no guessing needed here…if you toss a projectile with these, you can hit the target every time, or intercept an incoming meteorite, or…! Before you get too excited, don’t do it, kids! other than for sporting/educational purposes.
We need to consider gravity of course. We’ll just feet and seconds as the units. Easy to convert to meters and such as needed. The g is 32.17 feet/s^2 (or some of us educated internationally as well remember it as 9.8m/s^2).
Using that and intial velocity, and angle, the formula above is translated into the following in Excel. Where D2 is g (gravity). D4, D5, ….Dn are the x values (horizontal distance). Cell B4 contains the angle in degrees (I had to convert to radians before using it properly in Excel), and A4 is the velocity.

In the above sample x, y range, only up to 100 distance units are shown, but in reality, the range goes on much farther down the table to draw a decent trajectory.
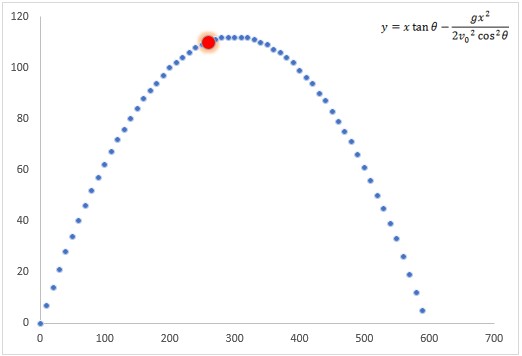
With this information now, we can plot a graph using x,y values as coordinates throughout the projectile’s journey. However, to make it more fun, I added another point: Target. This way, we can set any target location, and then manipulate the initial velocity and angle to find exactly when and how the target can be hit!

The target in the above sample plot is shown as a glowing red point.
The Gamification Part
To make it easier to hit the target, I added a range of errors, within which error threshold, your projectile can hit the target. For example, I set it to within 5 units (x,y). So, if the target is at 200, 50 and you entered some velocity and angle that produces a point in its trajectory that goes through 202, 48, I’ll consider it a HIT. Outside of that range, it’ll be a MISS.
So, we need to set up the input values that creates the data range (of trajectory), which will plot it, as well as add a series called ‘target’ with its point (in red for example) on the plot. Then we check if your trajectory you created by your inputs go through a point (within the error margin explained above) where target is located!
The key thing to keep in mind is that Excel doesn’t have key:value pair concept as in C/C++, Java, Python, etc. So, we have to make sure that not only do we find x value correctly, but its associated y value must be corresponding. Think about where x can values such as 0,10, 20, 200 because it’s linear. But for y values, it increases then decreases possibly repeating exact numbers. That’s where you have to be careful about using lookup functions. The way I solved it is by matching first the x value in the plot with target’s x, and then finding its index position and extracting its y value from that position. Then decide if they both fall within the error margin and occurred in the SAME index position (e.g. row number). If so, we have a HIT.
With that logic sorted out, let’s see it in action!
In Action
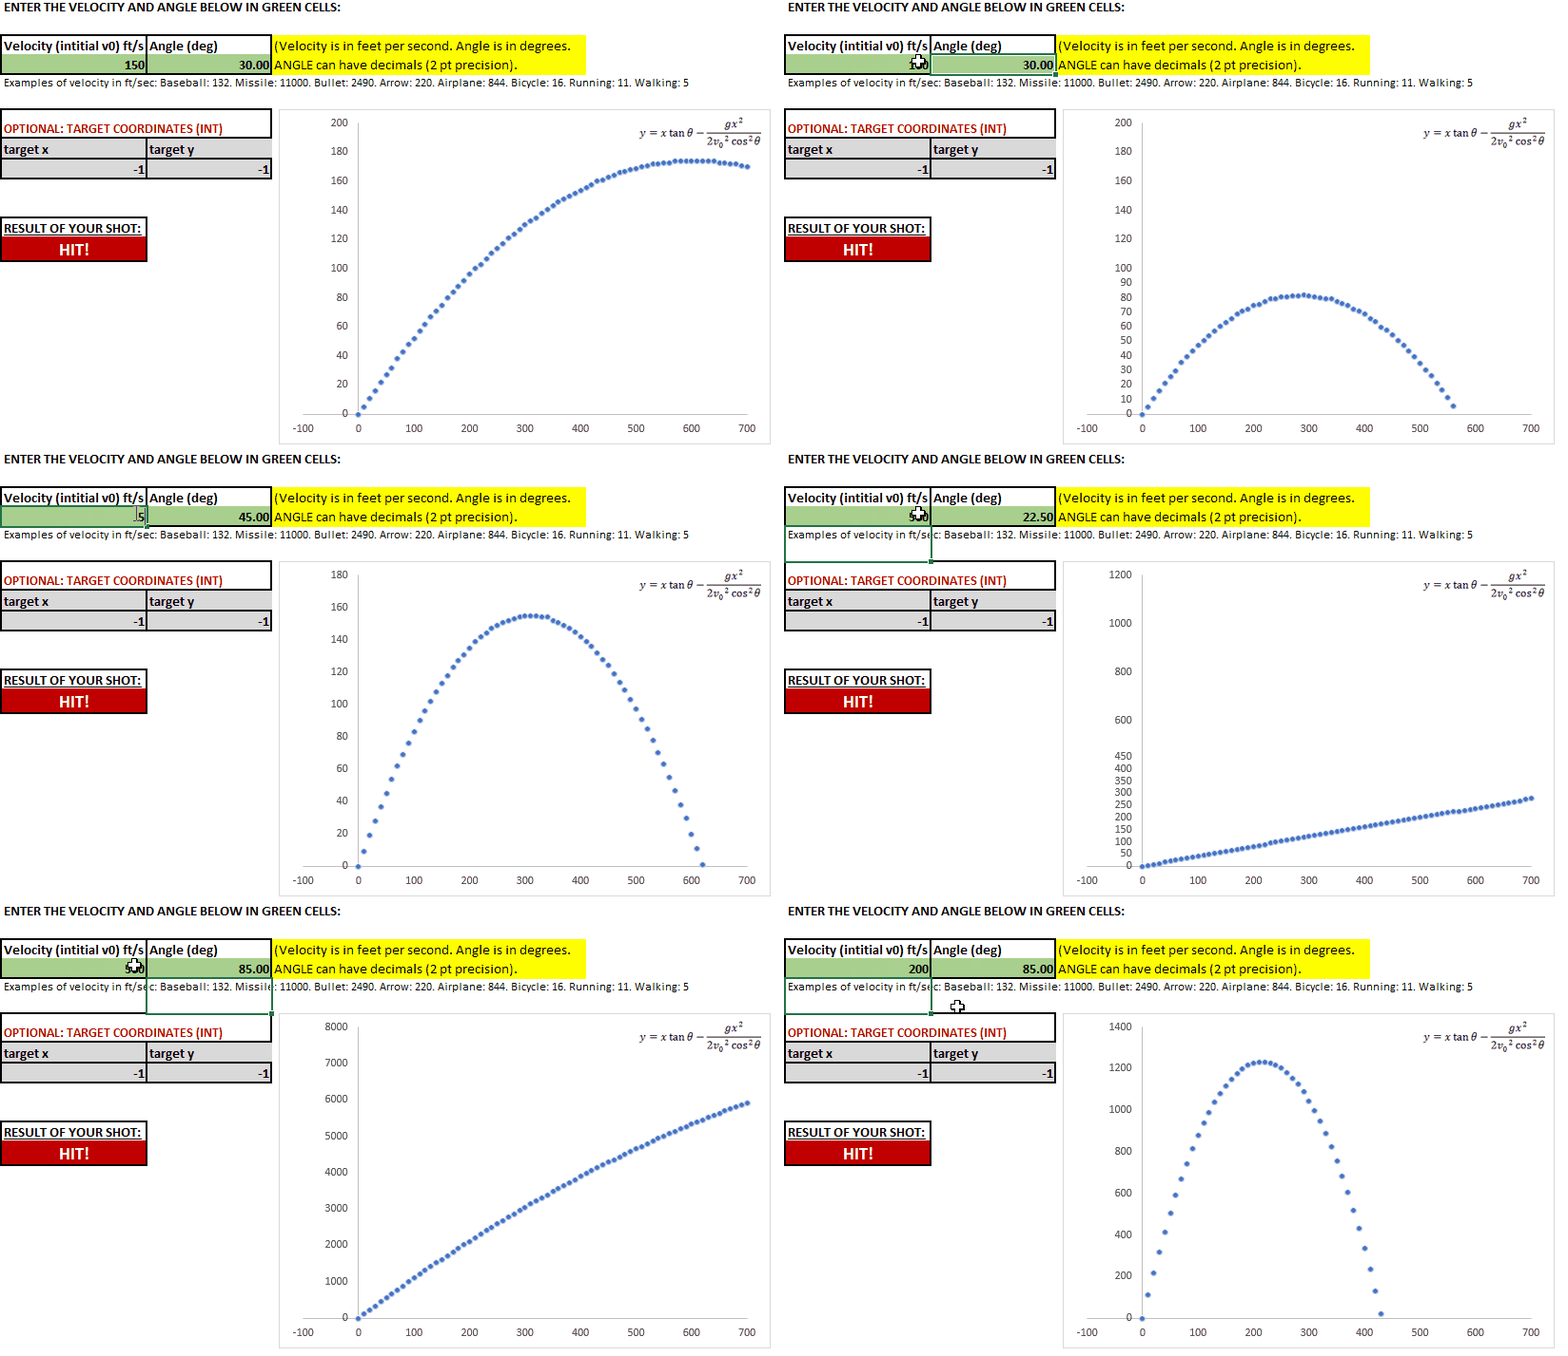
The following shows the actual trajectory being plotted based on the inputs (no target is set yet).

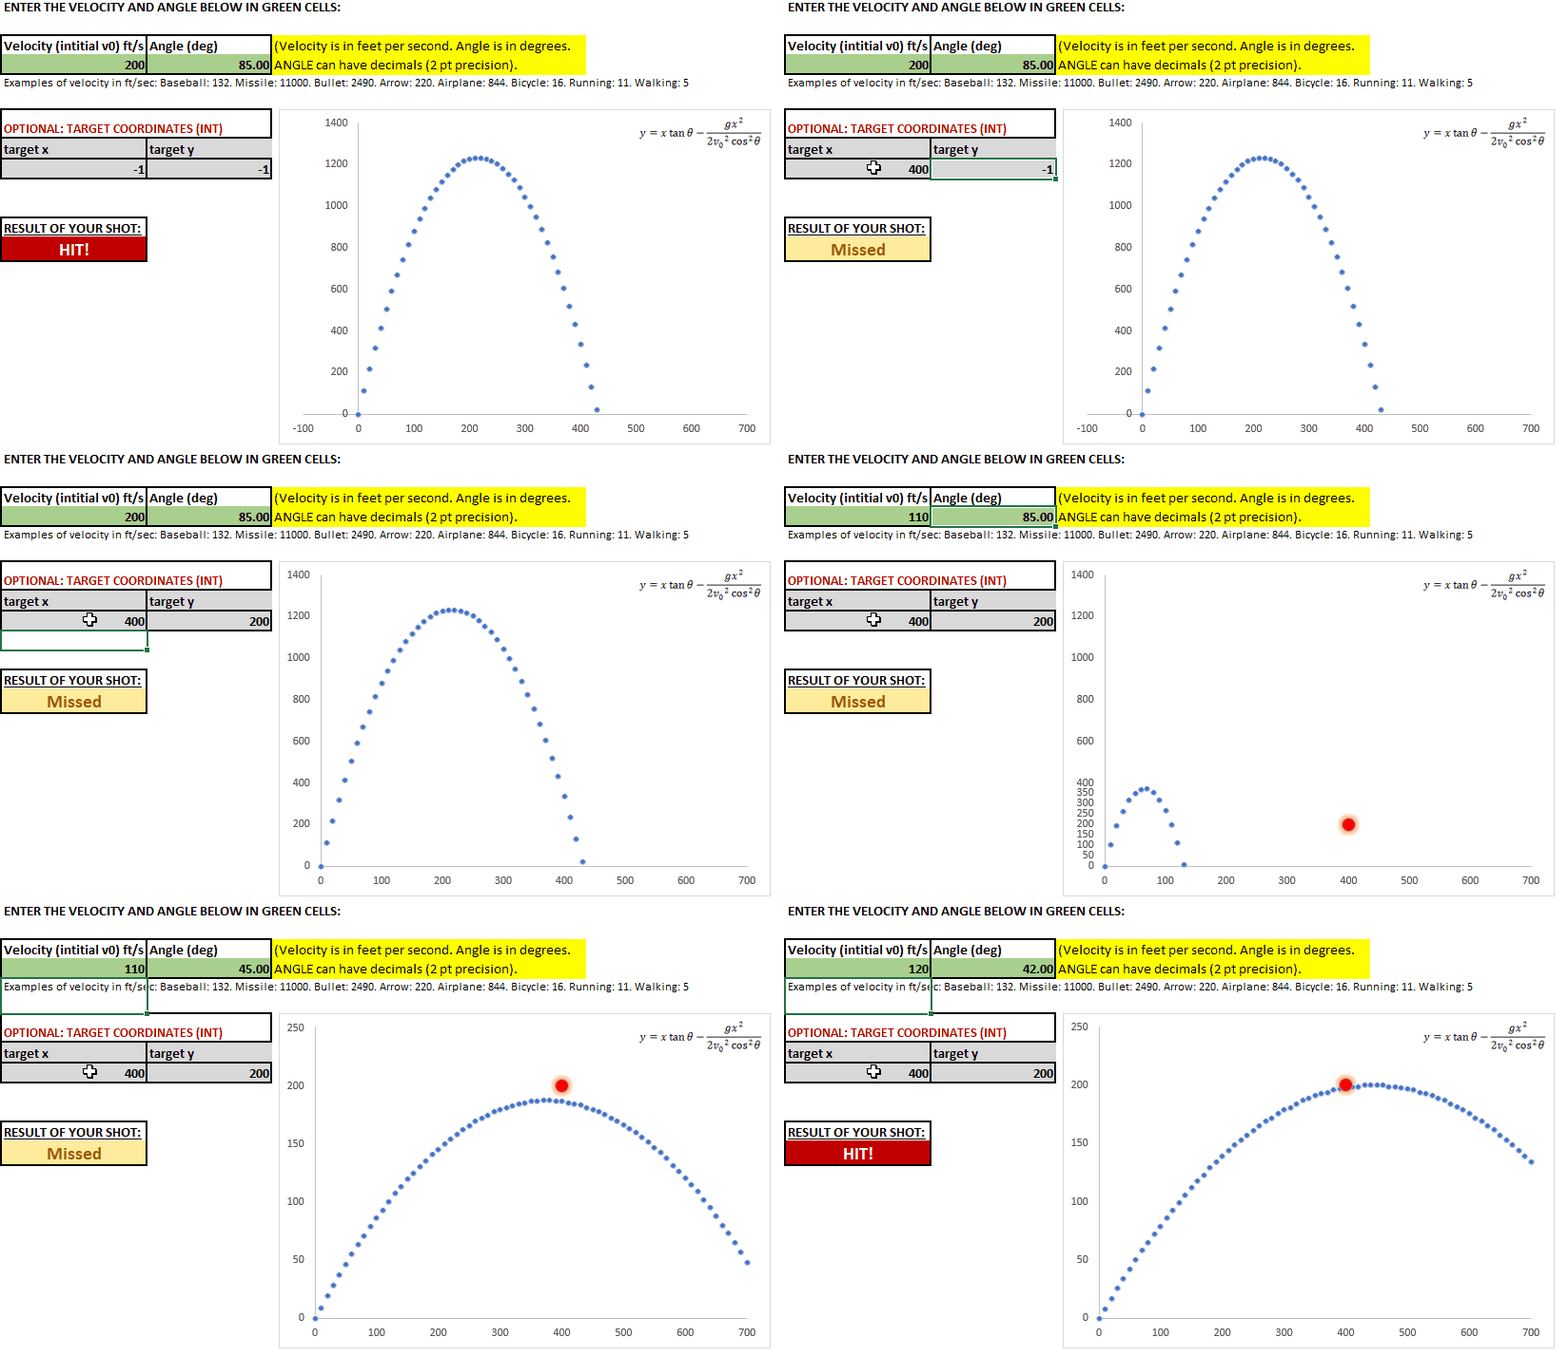
The following one sets a target at 400,200 feet coordinates. And I entered different values of velocity and angle of release to hit it!

I actually had a lot of fun building this in Excel mainly because of the unique challenges it provides (e.g. lack of in-place calculations, and key:value data types, etc.) and certainly I didn’t want to create it in VBA (I’d rather do it in Python or C/C++ for all intensive purposes). Hope you found some inspiration from this…how would you use trigonometry, physics and gamification in Excel? Always looking for ideas 😉
As I don’t have time for explicitly explain all the details of my technical blog, feel free to reach out to me from the home page if you need technical help/samples/workbooks, etc. I may be able to provide more assistance (depending on my time availability and gravity of your need). Since I write the educational blogs on my “free” time, donations on extra help are always appreciated.