How to load a subset of data from a full dataset with given percentages proportions by a column (“Group” in this example) plus how to import/export the Excel data file.
Objective:
We have n food items from 4 different groups: dairy, fruits, protein, vegetable in an XLSX sheet with a header and 3 columns: Name, Group, Comment. Each column’s cell can have multiple words.
We want to load a sample dataset from the XLSX file that picks some rows from the Group column
such that: 30% of the picked sample are ‘vegetable’ from Group column, 30% are ‘protein’ from Group column, 20% from ‘fruits’ from Group column, 20% from ‘dairy’ from Group column.
Solution steps:
Use pandas lib for Excel and dataframes.
Load the entire dataset into different lists (same number as the Group unique values) based on their Group column values.
Calculate the number of rows for each group should get based on the percentage desired: x% * (total length or rows of source dataset).
Then use random lib for random.sample() e.g. random.sample(list_of_group, num_of_rows_for_each_group)
and keep adding each group’s sample into a List (selected_rows)
Convert the sample dataset (selected_rows) to pandas dataframe to print and also to save to a new Excel file (or CSV or text).
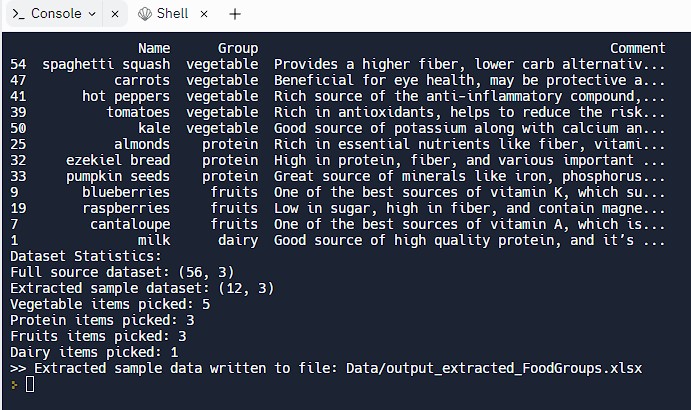
Then print the output showing the selected sample rows and their values from Name, Group, and Comment columns.
Finally, export the selected sample dataset to a new XLSX file.
Output:
An example of its output is shown below. The beauty of this is, every time we run it, it’ll extract random rows while respecting the percentage distribution specified as best as possible with the given source dataset.

Full source code is shared on Replit repo and embedded below:
This is a very powerful and useful technique I use for various data analysis tasks. Given this information, a good practice for the readers would be try to complete the following exercise.
Exercise: You have a dataset of 100 students, mostly males but also has females (exact distribution for the source doesn’t matter as long as you have more 25 rows for each gender) which has 3 columns: Name, Gender, Score. The Name column has the students’ namess, Gender has “Male” or “Female” for each row, and Score has an integer value of 50 to 100 for each student. No blanks or missing data.
Objective: Your objective is to pick students whose scores are higher than 80 AND the chosen list must be 50% male, 50% female!
Have fun!