This post is a continuation of or complementary post to about using Excel and SQL for pop-quizes. Please read that first to get proper context…otherwise, this wouldn’t make much sense. As discussed in the post linked above, the SQL queries can be saved from Microsoft Query Editor to an external file. It’s really convenient because […]
Tag: Excel
Pop Quiz [and Solutions with Low Code!]
Every now and then I see some simple quizzes pop-up on Facebook such as: “Name a state without letter A in it.” The letter can be another, they just switch it around from time to time. This particular post is inspired by such posts. Sure we can go through all the states in our heads […]
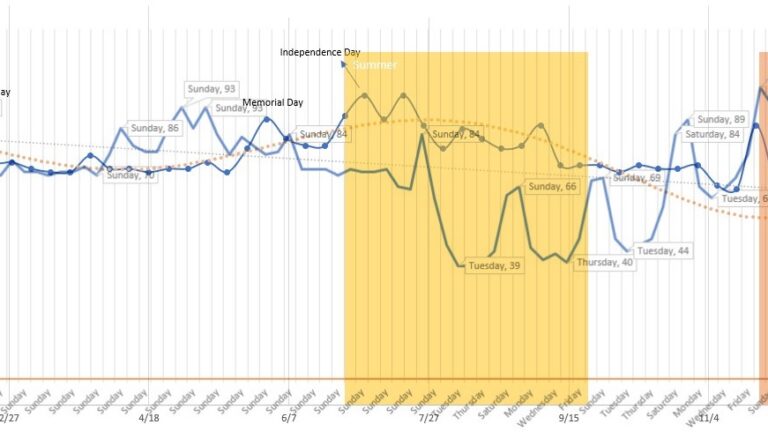
Understanding Trends: Real-world example
Trend analysis is a pivotal part of business analytics, project planning, marketing, and virtually all aspects of strategic planning and understanding of patterns/behavior. In this post, I present a straight-forward but very practical use of some analytics and walk you through: 1) Data collection 2) Data cleanup and shaping 3) Creating trends and understanding the […]
BACTERIAL GROWTH SIMULATION (Binary Fission)
Here, I present a quick simulation application (runs in the browser) of population growth of bacteria that mutiplies following binary fission reproduction. Basically, it’s the division of a single cell into two or more cell and the regeneration of those parts to separate cells resembling the original. To play the simulation, just navigate to the […]
Did your promotion work?
In an earlier blog How Well Are Your Incentives Working? I shared methods on how to calculate the various chances of success based on some campaign data (e.g. new sign-ups for membership) from various trials using Binomial distribution. In this post, I show how to determine if events occurred due to random chance or affected […]
Waffle Charts (3 methods + bonus)
Certainly! Here’s a revised version of your paragraph: Waffle charts might be familiar to you. These charts are characterized by small squares within a grid, providing a straightforward representation of ratios. This concept is akin to that of pie charts, area charts, or treemaps—the choice ultimately hinges on the target audience and personal taste. Waffle […]
Counting words/elements correctly in Excel
In some of my previous posts, you’ve already seen my Python examples on how to count words accurately in a document or in blocks of text (search for: Wordcloud). It’s also possible to count the words in Excel, but we have some gotchas there to be aware of. In this blog, I demonstrate some of […]
Analyses of Critical Words & Speeches!
In one of my earlier blogs, I shared the techniques and code to create Word Cloud using Python and Excel together in this article: Word Cloud III – Python & Excel Together Today, building on that, I’ll analyze some of the most historic speeches and/or documents that every kid should read and even memorize part […]
vCards to/from CSV/Excel (and more)
vCards. What are they? Here’s a blurb from wikipedia:vCard, also known as VCF, is a file format standard for electronic business cards. vCards are often attached to e-mail messages but can be exchanged in other ways, such as Multimedia Messaging Service, on the World Wide Web, instant messaging or through QR code. They can contain […]
Using Directions & Travel APIs With Excel, Python. 2/2
This is the second part of the getting directions and travel info using Bing Maps. The first part shows how to do it in Python (check it out here), and in this part, I’ll share some tips on how to get the same info from within Excel without writing any VBA code! To get the […]