The following charts are based on real datasets (plotted in Excel) that I created (for mainly humor, but probably not too distant from the truth) in order to attempt to visually depict relationship dynamics. The way to read them (or to get the most humor out of them), is to recognize that the x-axis shows one partner’s values, and y-axis shows the other partner’s values. The “values” in this case, could be happiness, success, mood, energy…something positive. Now combine that with your statistical knowledge (even basic is fine). Let’s go through them…
Nurturing relationship:
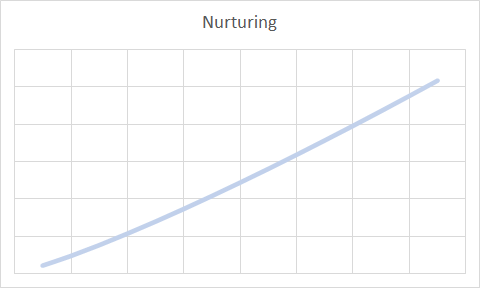
In a nurturing relationship, as x values go up, so do y values…creating a harmonious, positive linear relationship.
Toxic:
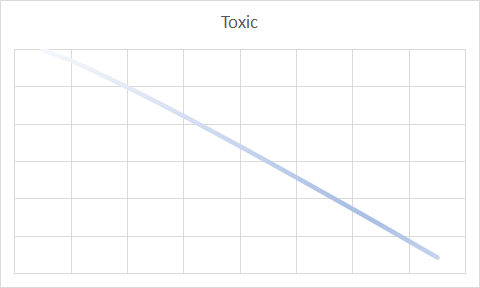
In a toxic relationship, as x values go up, y values are keep going down, meaning it’s an inverse relationship. That can’t be good for this relationship!
“It’s complicated”:
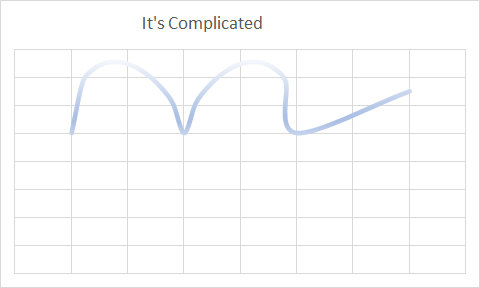
In a complicated relationship, one partner is positive, the other also shares the excitement, but only up to a point, after which it becomes kind of toxic. And the cycle sort of repeats.
Dramatic relationship:

In a dramatic relationship, as one partner feels happy, the other may or not may not share the sentiment or feelings, it’s harder to predict as it’s not linear, nor seasonal, quite unpredictable leading to a turbulent relationship between x and y.
On and Off relationship:
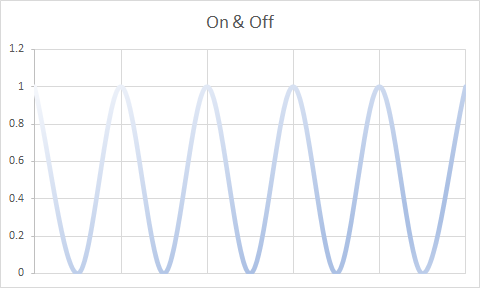
In an On-and-Off relationship, things go well and peak and then suddenly breaks down, and the cycle repeats. There’s no telling when the relationship will end or reignite.
Bumpy relationship:
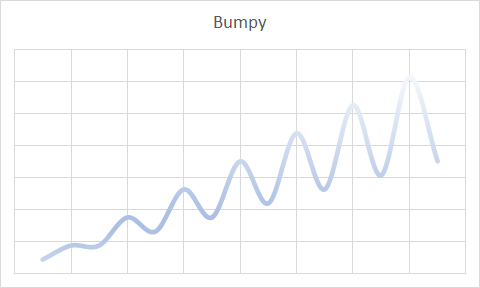
In a bumpy relationship, it progresses amid lots of ups and downs; over time it improves slightly but not without many bumps along the way.
Short-lived relationship:
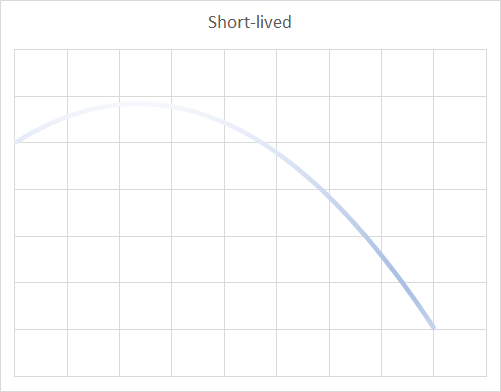
In a short-lived relationship, it starts out with promise, soon after some incidents or gaining more knowledge of one another, it peters out quickly.
And now, the most complicated chart of all for the…
Love Triangle:

Here we have 3 variables (x, y1, y2) or people in this context inter-related. Although the shape turns out to be a heart, it’s a complicated relationship of love amongst the 3 players. From relationship POV, I call it the love triangle because if we represent x-axis as a person, and y1 and y2 are two other persons in relationship with x, as x values change the y1 and y2 values tend to change with same magnitude except in almost different directions but not quite inversely.
Statistics lovers…I know you appreciate this 😉
▛
Interested in creating programmable, cool electronic gadgets? Give my newest book on Arduino a try: Hello Arduino! 