This is part 2 of the original series on Rabid Racoon. Please read Part 1 first to follow along.
So, this time we’ll use a real-time graphing method using Python’s Turtle library instead of scatter plot as we did in Part 1. The beautiful part is, since we already created our custom Class in Part 1, our new code is going to be extremely small with no change needed in the Class code.
So, let’s create a new .py file for this code (without even touching our Class code file. Remember the name where the Class code lives and its Class name as before).
The Code:
import random
from turtle import Turtle

# now import the class and methods defined in TakeAWalk in random_walk1.py file
from random_walk1 import TakeAWalk # implies random_walk1.py exists in current dir and it has TakeAWalk class.

# instantiate a random walk
tw=TakeAWalk(50)

tw.make_stops()

t = Turtle()
t.screen.bgcolor("orange") # choose whatever color of your choice
colors = ["purple", "black", "brown", "white", "lightblue", "yellow"]; # choose whatever colors of your choice

for i in range(tw.num_points):
   t.goto(tw.x[i]*10, tw.y[i]*10) # scatter plots take arrays but turtle.goto() is int for each x, y.
  # And because it's not a chart, I just multiply each pixel 10 to prevent extreme overlapping for proper spacing.
   c=random.choice(colors)
   z=random.randint(1,10)
   t.dot(z,c) # draw a dot with size and color at the current goto position of turtle
Just as before, we import random and our Class. But we also import turtle library as you see above for real-time graphics. Note, that I called TakeAWalk() passing it argument of 50 this time. Rest of the code has relevant comments starting with ‘#’.
The Output:
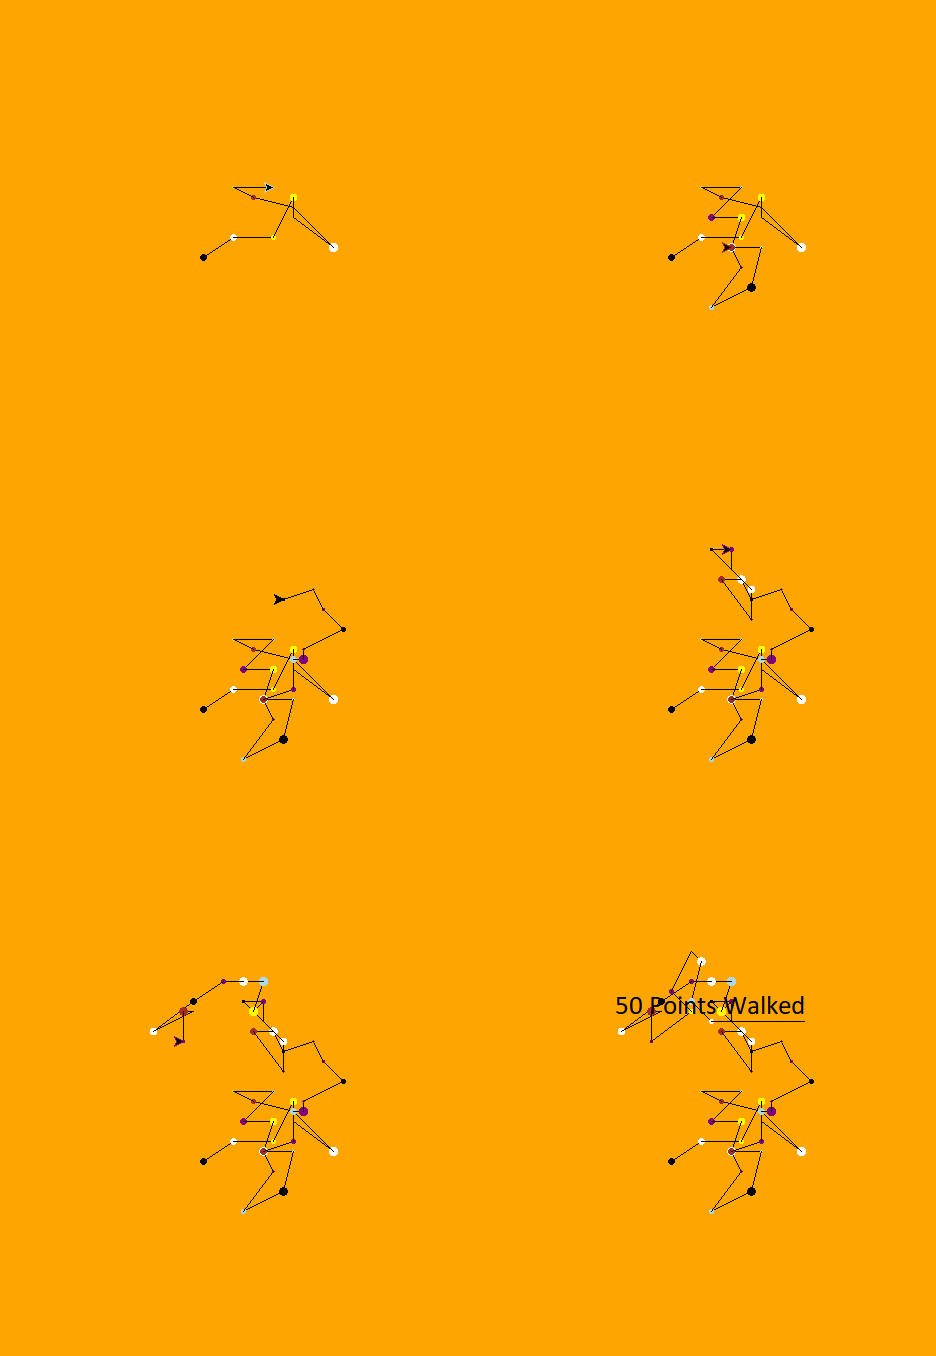
Here’s a sample animation of the output being generated from above code.

Hope you have fun with this! Happy coding 🙂
BONUS: By adding the following line, I generate the final label with exactly how many points were “walked” by the racoon at the end of animation:
s=str(tw.num_points) + " Points Walked"
t.write(s,move=True,align="center",font=("calibri",20,"normal"))