Now that the 2019 NFL regular season is in the books, we have complete data available about the teams’ performances. What can we glean from them? In this blog, I share some findings, answers, and the process of analytics behind discovery of the answers.
I will focus on overall team performance data, not individual positions, nor specific game statistics. Data for those are also available but that’s not the story I want to share in this blog. (If you’re interested in QB specific metrics, you can find one of my blogs that does just that using Excel on this site).
Let’s get started with free information available on hand, and using Excel, we will dig deeper and look at the metrics from various interesting angles.
From https://www.nfl.com/standings page, we can get some basic information. In fact, I’ll use only a subset of that information from it. Once I prepare my datasheet accordingly, I calculate the easy metrics shown below in shades of blue. Everything else was from the site above.
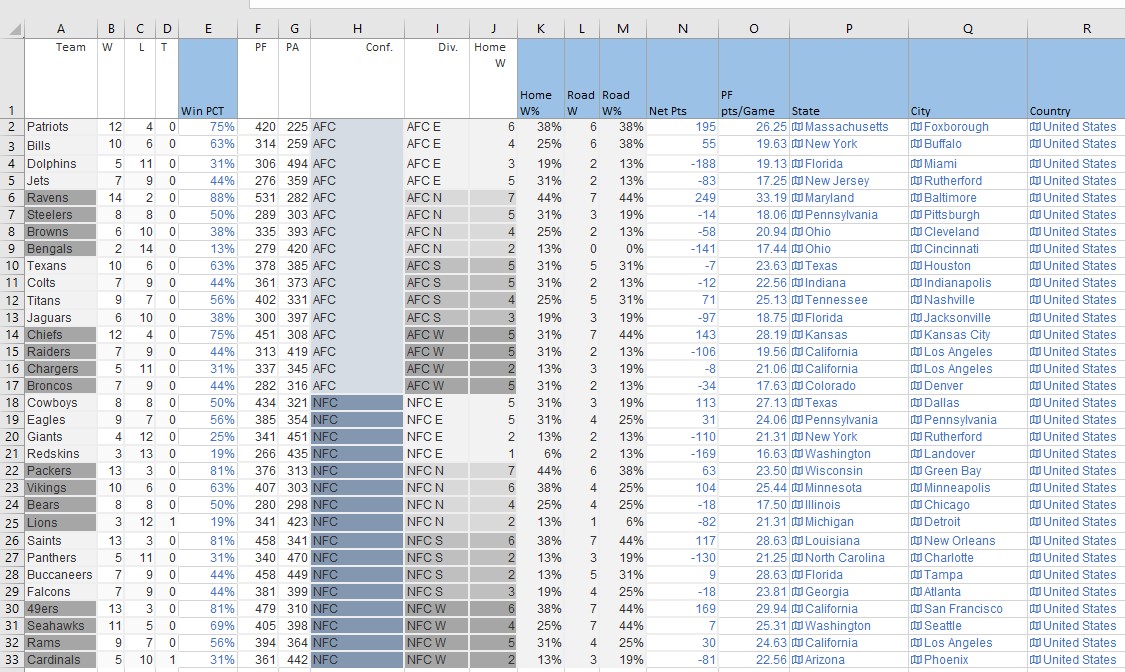
So, I categorized the teams in Conference and Divisions myself and the basic calculations without having to copy/paste any more data than necessary. You’ll also notice that locations (e.g. State, City, Country)…these I created as Geography data types and using Excel, I was able to extract information on State and City…which we’ll use for filtering later.
The Questions
With only this data, I want to answer the following questions:
- Which teams had scored 29 or more points per game?
- Which teams had scored 29 or more points per game AND at least 1 loss?
- Which teams had at least 1 tie?
- Highest points scored per game:
- in AFC and which one(s)?
- in NFC and which one(s)?
- What was the highest points scored per game in all conferences? And by which team?
- Which team has the highest NET POINTS differential (points scored for vs scored against total)…for AFC, NFC, and ALL conferences?
- Which team has the worst NET POINTS differential? (points scored for vs scored against total)
- Which team(s) had won at least once with average scoring of <=17 points per game?
- Which team(s) has/have the best home record?
- Which team(s) has/have the worst home record?
- Which team(s) has/have the best road record?
- Which team(s) has/have the worst road record?
- Which team(s) is/are the most balanced when it comes to Home vs Road games?
- What’s the correlation between PPG and wins?
- What’s the correlation between total points scored and more wins (total)?
- How many points does a team need in total points at the end of this regular season to have 90% chance of total wins?
- How many points does a team need in each game to have 100% chance of a win in that game?
- Show me win-loss-tie in one, neat chart.
- And also I want to only see teams from certain State, Conference, Division and their stats as I desire.
Sounds like a long list of desires, but not too daunting actually. Let’s solve them one-by-one.
The Answers
The beauty in discovering the answers is to find a method that’s scalable not just for this season but any season! And one that requires minimal manual calculation and time. So, we’ll use Excel’s formulas and features to yield the answers one by one…
Q: Which teams had scored 29 or more points per game (average over season)?
Using IF() we can find the answer using the following formula and simply drag it out down for the rest of the teams’ rows. =IF(O2:O33>=28.5,A2:A33,””)
(See the first table image for cell references)
ANSWER: Ravens, Saints, Buccaneers, 49ers
Q: Which teams had scored 29 or more points per game AND at least 1 loss?
ANSWER: Ravens, Saints, Buccaneers, 49ers
This is done by multiple criteria checking =IF(AND(C2>0,O2>=28.5),A2,””)
If we also wanted the count of teams, we could get that by =COUNTA(T2:T33)-COUNTBLANK(T2:T33)
Q: Which teams had at least 1 tie?
ANSWER: Lions; Cardinals
Instead of manually counting the column T, we can do it this way that’s scalable to millions of rows!
=TEXTJOIN(“;”,1,IF(D5:D36>0,A5:A36,””))
Q: Highest points scored per game in AFC and which one(s)? And in NFC and which one(s)?
ANSWER:
AFC: 33. Ravens
NFC: 30. 49ers.
Finding the highest is easy using MAX(). However, since there can be zero or more teams that match the criteria, we can use this formula: =TEXTJOIN(“;”,1,IF(O2:O17=F42,A2:A17,””)) where F42 contains the MAX value of PF column.
Q: What was the highest points scored per game in all conferences? And by which team?
ANSWER: 33. Ravens.
Q: Which team has the highest NET POINTS differential (points scored for vs scored against total)…for AFC, NFC, and ALL conferences?
ANSWERS:
AFC: 249. Ravens. NFC: 169. 49ers.
ALL: 249. Ravens.
Q: Which team has the worst NET POINTS differential? (points scored for vs scored against total)
ANSWER: -188. Dolphins.
Similar to above logic, using =TEXTJOIN(“;”,1,IF(N3:N34=F48,A3:A34,””)) where F48 is the result of MIN() from N column.
Q: Which team(s) had won at least once with average scoring of <=17 points per game?
ANSWER: Jets; Bengals; Redskins
Formula =IF(AND(B2>0,O2<17.5),A2,””)
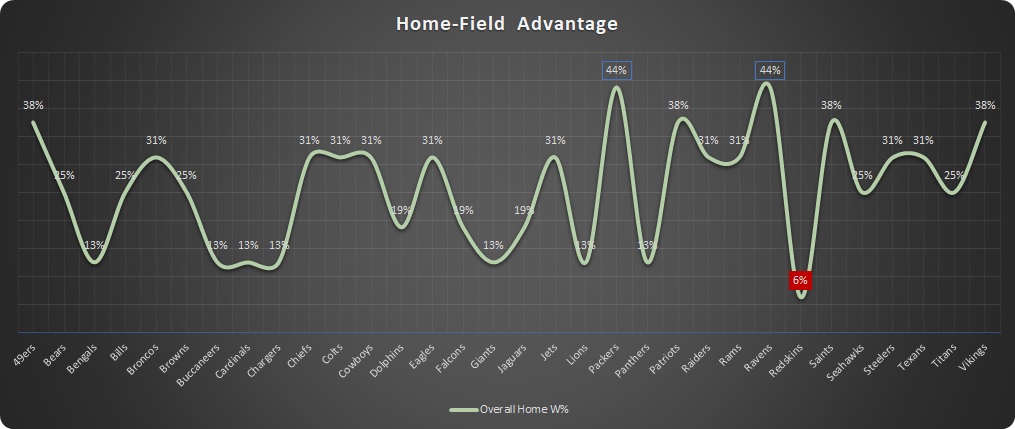
Q: Which team(s) has/have the best home record?
ANSWER: Ravens; Packers
Formula: =TEXTJOIN(“;”,1,IF(K2:K33=MAX(K:K),A2:A33,””))
Q: Which team(s) has/have the worst home record?
ANSWER: Redskins.
We could continue to use formulas to get our answers, but for fun, let’s take a charting approach to answer this and the remaining questions with visualizations.
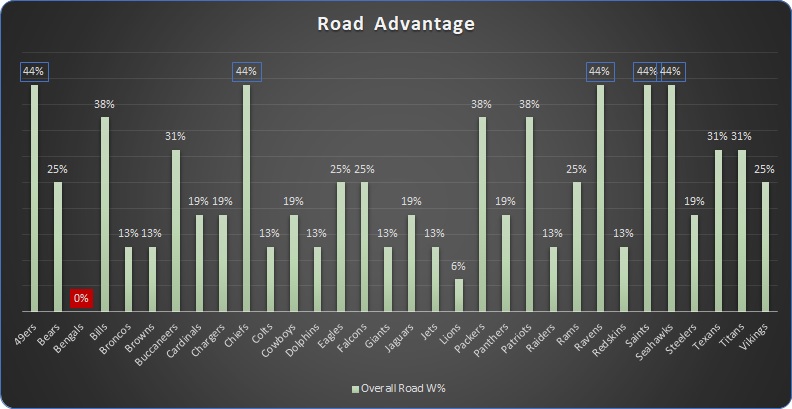
Q: Which team(s) has/have the best road record?
ANSWER: Several teams (all playoff bound!): 49ers, Chiefs, Ravens, Saints, Seahawks. All at 44% wins on the road.
Q: Which team(s) has/have the worst road record?
ANSWER: Bengals. Didn’t win a single road game.
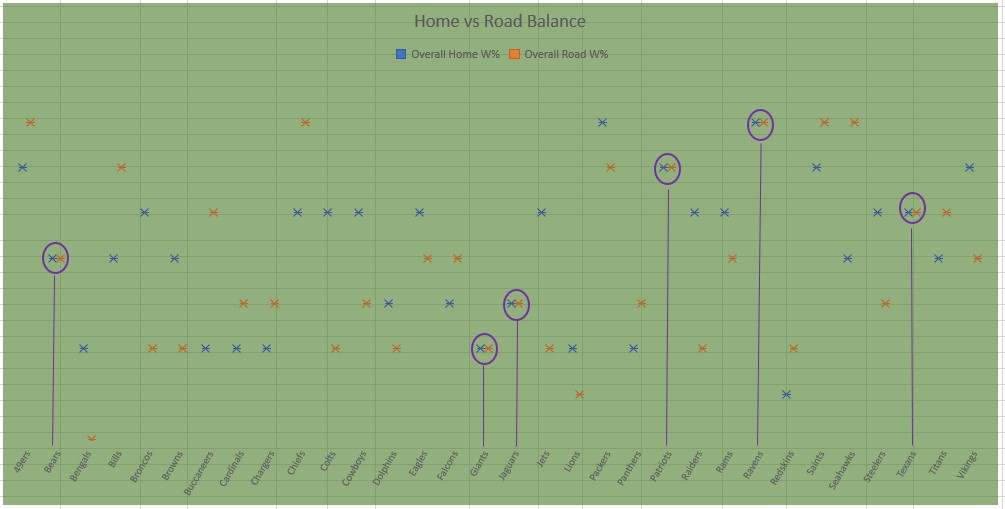
Q: Which team(s) is/are the most balanced when it comes to Home vs Road games?
ANSWER: Bears; Giants; Jaguars; Patriots; Ravens; Texans.
This is most obviously answered in the following chart:
As you can see the home wins vs road wins markers are aligned perfectly where the teams are about 50-50 at home or road.
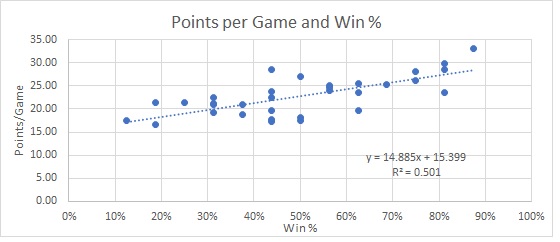
Q: What’s the correlation between PPG and wins?
ANSWER: There’s a strong connection between a team’s change of winning and points scored per game as shown below.
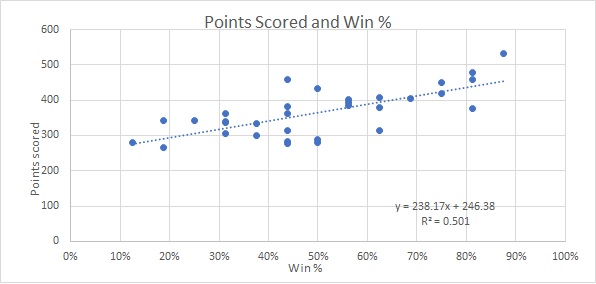
Q: What’s the correlation between total points scored and more wins (total)?
ANSWER: There’s a strong connection between a winning team’s record and total points scored per game as shown below.
With these 2 charts, we can find answers to the next 2 questions…
Q: How many points does a team need in total points at the end of this regular season to have 90% chance of total wins?
ANSWER: In 16 games, based on this season, a team with total score of at least 461 points had a 90% chance of beating any team!
Q: How many points does a team need in each game to have 100% chance of a win in that game?
ANSWER: If a team scores 30 points or more, it has 100% of winning the game based on this season’s stats and teams.
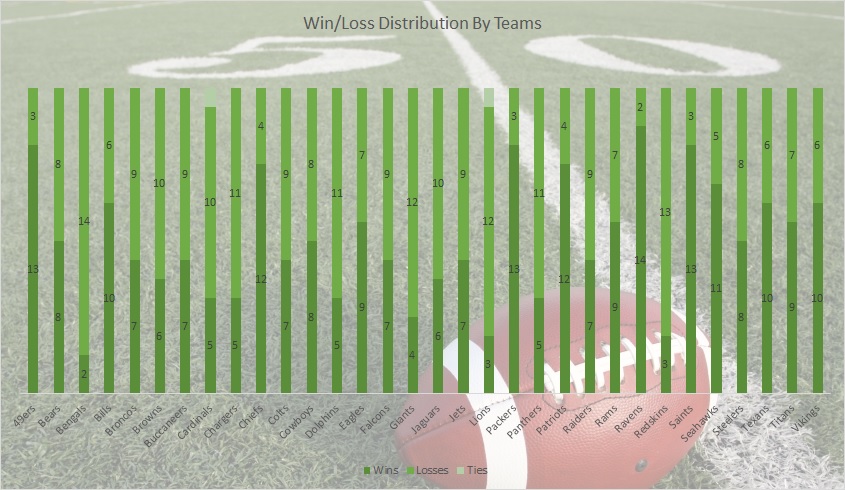
Q: Show me win-loss-tie stats for all teams in one, neat chart.
ANSWER: The following chart does the trick. We could make in interactive but you didn’t ask for it 😉
Q: And also I want to only see teams from certain State, Conference, Division and their stats as I desire. That is, make it interactive.
ANSWER: Ok, now that you asked for it 🙂 Here it is. Here’s a pivot table with the basic stats for all the teams…
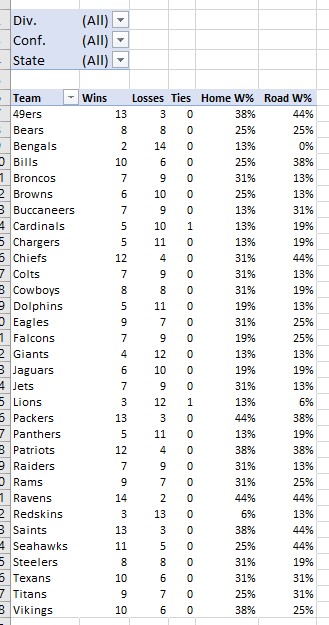
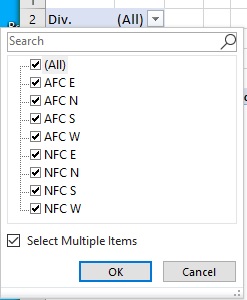
To look at specific division, click the Div. dropdown and select one or more, and the table will refresh only with teams’ stats for the selected divisions…
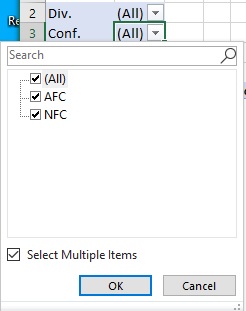
Or, you can choose specific conference(s) from the Conf. dropdown…
You can also choose by State! For example, if you choose California, or Texas you’ll get only their respective teams’ stats…
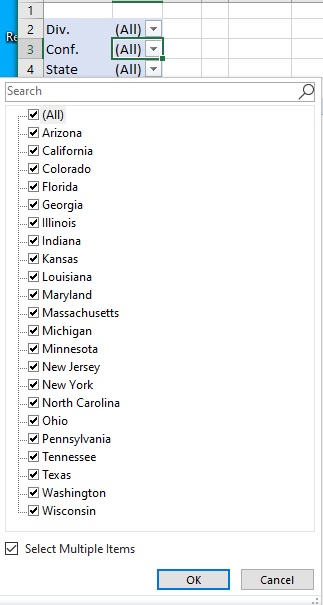 Remember, how I mentioned about adding the geolocations? This is where it comes handy.
Additionally you can mix and match the filters’ combinations above.
Hope you’ve enjoyed following this blog and was able to follow along from start to finish…a sample journey starting from a simple dataset to intriguing discoveries!
As always, if you need more information, source dataset, the finished workbook with formulas, feel free to contact me directly. Now, off to the playoffs!