In this blog, I show you how to use draw graphics in Python.
Objective: I want to draw dots (circles, really if they’re larger than a pixel)…of different sizes and colors at various locations multiple times (I chose 100X for this demo). This is how the output looks like:

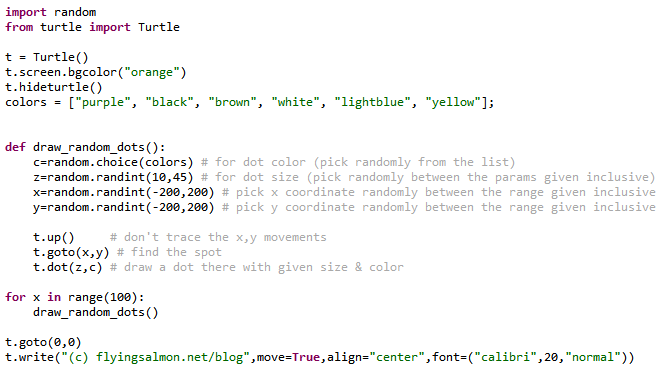
Source Code: The complete source is below.

Setup: In order to code and run Python you’ll need an IDE from several to choose from that also makes it easy to run the interpreter, etc. There’s a list here (not going deep in to setup in this blog). I’ll use Turtle library that enables cool graphics.
Explanation: The first 2 lines of the code is about importing random module (because I’m using randint() method of random object to pick random color, size, and position for the circles. We create a Turtle object by calling its constructor: Turtle() and save a handle to the new object called t. I define a function called draw_random_dots() that simply draws 1 circle with all random attributes calculated within the function as above. Then I just call it 100 times 🙂 NOTE that if I didn’t use the up() method on Turtle, there’d a be a line drawn from reach circle to next. Because I didn’t want those lines to appear.
How would it look if we did want to have the lines? (i.e. if we didn’t call t.up())? Here’s that output:

Next Steps: There’s a lot more to Turtle library. I learned some of them from this online guide. Experiment with it and have fun!