In this blog, I touch on a core function that’s used in many machine learning scenarios whether explicitly or as a part solving a given problem.
This is extremely useful for recoding values for classification (binary or multiclass) where we need to map some categorical values into a finite range of values (e.g. 0 or 1; yes/no; yes/no/maybe). A binary classification involves getting answer of 2 possible values (e.g. 0 or 1; yes/no); whereas multiclass classification involves getting more than 2 answers (e.g. yes/no/maybe; Very satisfied, Satisfied, Neutral, Dissatisfied, etc.)
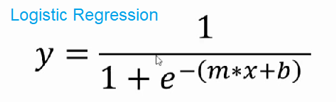
Logistic Regression makes used of Sigmoid function. It is:
Sigmoid function (z) = 1/ (1+e^-z)
Where e is the Euler’s number, and z is the input number to map.
We apply linear regression (as shown in my previous posts) when we want to predict a value (via machine learning) and get an output that is a continuous value…with particular limits. Based on several data points, it draws lines that cross most of the data points and picks the best fit (regression line) and gives us the equation that expresses the realtionship between independent and dependata variables. It’s formula is:
y= mx +b where b is the intercept; y is depedent and x is independent variable. To give a real-world example, we can predict y (bought insurance or not—or for prediction, we can rephrase it to say if they will buy the insurnace or not) based on x (age). This gives the probability of a client buying insurance at any given age.
However, when we have a binary classification problem like this, linear regression will not accurate results, instead, we need to use Logistic regression. The logistic insurance function is:
It is computed basically by taking the linear regression line and turns it into a s-curve (as opposed to a straght line). This shape ensures most datapoints will be covered. Here’s the conceptual relationship between Linear and Logistic regressions.
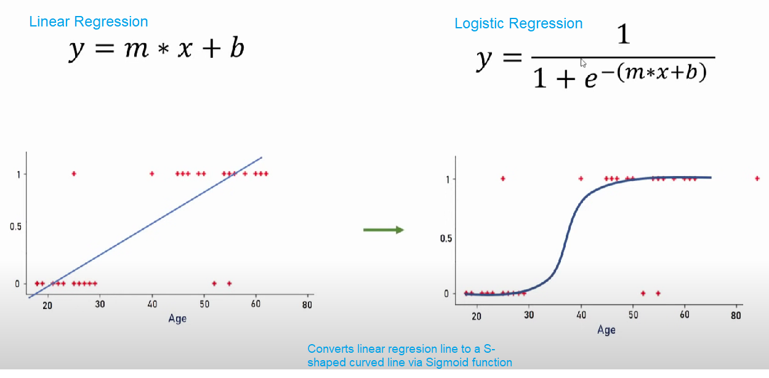
As you can see in the figure above Linear->Logistic model conversion is done by Sigmoid function.
A Sigmoid function therefore maps any given number into a range of 0 to 1 (inclusive). The following table shows a set of input values in column B that has been converted to a scope range of 0 to 1 values via the Sigmoid function in Excel. I added the formula manually as there’s no built-in Sigmoid in Excel (without add-ins) that Python offers.
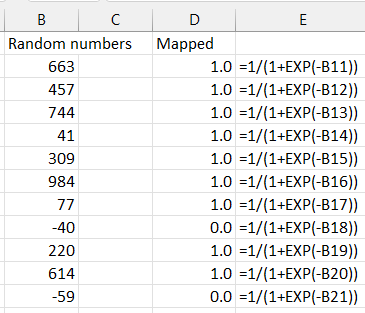
Column E shows the exact formula I used for each row (first row is 11 in this example).
In the next blog post, I’ll find the chances of someone buying life insurance at a given based on some dataset, using Logistic regression leveraging Machine Learning both in Excel and Python. Be sure to check out that one!
▛Interested in creating programmable, cool electronic gadgets? Give my newest book on Arduino a try: Hello Arduino!
▟