With the World Cup, Copa America underway, obviously I try to catch some games and follow the scores on matches I missed. The other day I noticed a chart on BBC site that showed charts with points plotted on a field where the ball had traveled on a particular game.
This got me thinking, how would I do this in Excel? Well, it turns out it’s not too difficult as Excel offers the ability to do all that and more. The difficult part is actually the data shaping. How to arrange the data in a way that communicates a clear, meaningful story. Let’s say, we want to understand how a particular goal occurred. If I were a coach of either the attacking or defending team, I want to know from first pass to the goal how and where the ball traveled, where the defending players were, how many passes did it take before the final shot? Sure, old-fashioned coaches could watch the “tape” over and over again, but these days most of the successful teams analyze data, not just videos but transforming the plays into quantifiable, calculable numbers that can be viewed and modeled in many different ways.
In this blog, I share the process by which I created the story, laid out the data, then plot them into a meaningful and attractive chart…all done using Excel with its built-in features without having to do any graphics manually.
First, let’s build the story. A goal was scored against my team. As a coach, I want to understand the movement of the ball (passes), and all its logistics (how many passes, which side of the field, what positions in defense were responsible, how defenders moved, etc.). I want to be able to visually share this information weeding out all the irrelevant information that might be on a video.
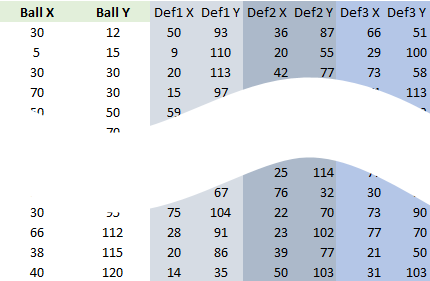
Then, we have to lay out the data in a way that can be easily plotted and still give us the desired information. So, I note the ball’s location from the first touch of the play until the goal. These are stored as coordinates. With each location, I also note the three key defenders’ movements (their coordinates) with each location of the ball at any given time. This is crucial. I could have easily extended the number of players I want to track to all 20 (not counting the goalies) but that would give me too much noise as not all players were relevant in that play. So, a sample data set looks like this:
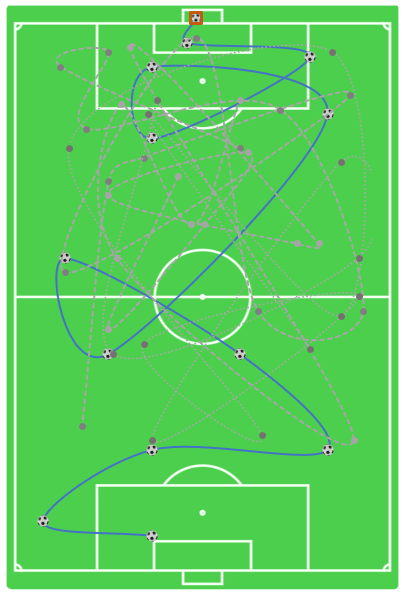
Next, I need to plot these points as multiple series. I then tell Excel to join the points with lines so I track the movements. And finally, I tweak the layout so the field is shown in a scale on top of which the data points can be accurately positioned. The field is scaled at 20 x 80 units. I want to show the ball movement in that score most clearly, while also showing the three defenders’ position without masking the important message.
Finally, tweaking the visuals (type of lines, markers for various points, final data point being the goal, using a custom marker…a public-domain soccer ball image, etc.), I generate this beautiful graph.
With this in place, it’s easy to add names and/or numbers of each player to the data point I want to track and also show their positions through the play if we wanted to.
Behind every goal, there’s science 🙂 Hope you enjoyed this. Data science is full of wonder and fun!
UPDATE + BONUS: With some creative thinking I was able to animate the goal without any special tools other than Office/Excel. Took me more time to experiment with the process, and there’s no 1 or 2 click solution to this, but it can be done relatively “cheaply” with some planning and creativity. Here’s a quick preview of the goal.
Attribution: Once the idea on this chart occurred to me, I reached out to one of my trainers Chart built from Chris Dutton of Maven Analytics: http://mavenanalytics.io/ asking him if he’d ever done something similar to that. He unsurprisingly had and was kind enough to share his prototype idea, which I materialized into this extended version along with animated charting.