In one of my previous posts, related to this topic, I shared the code and concept of reading polygon data and how to render them on screen with additional user-interaction. The post is linked below:
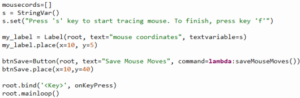
In this post, I share how to generate the data points for a polygon easily using your mouse. The mouse moves are captured when we press ‘s’ key on keyboard until we press ‘f’ to finish capturing. The data points are then saved to a file as a series of x and y values separated by commas in the same format as the previous post thus enabling us to read the datafile back using the program discussed previously.
The clip below shows the application in action:
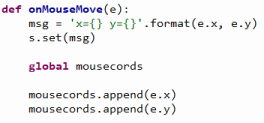
The UI consists of a button to save the captured mouse coordinates to an external file. The keyboard capture is done by binding my custom function onKeyPress() to start and finish capturing. And the mouse moves are captured by binding my custom function onMouseMove() to mouse movements.
The code is shown below:
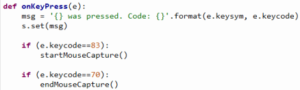
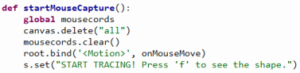
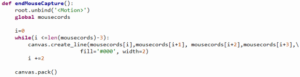
The custom functions startMouseCapture() is called when ‘s’ is pressed, and endMouseCapture() is called when ‘f’ is pressed. When finished capturing, I stop mouse capturing (so, the mouse moves to click buttons or just moving around are not erroneously saved as points part of the intended shape).
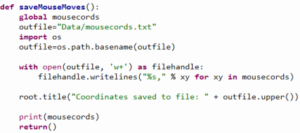
Once the button Save Mouse Moves is pressed, we save the captured datapoints to a file to be read back for drawing at a later time.
Notice that we don’t have to press left-mouse button to start capturing or press it again to finish the drawing as in most drawing programs. It’s a different paradigm. The start and finished are handled by keyboard commands, while the mouse is used to draw the shape. The ‘f’ (to finish captures) key instantly draws the shape as outlined by the mouse movement upon which we can decide to save it by click Save Mouse Moves, or if we want to start a new capture, we simply press ‘s’ again to start a new capture, which clears the canvas of any previous remnants on screen, clears all the points previously in memory, and prepares the program for a fresh new capture.
Note that in the above clip although I didn’t entirely close the loop in the circle, it connects the start and final points as part of the Polygon function (no fill “leakage”) when we feed the datapoints into the other application that renders the points back on screen.
Hope you found it informative and fun!
▛ This post is not meant to be a formal tutorial, instead it is to offer key concepts, and approaches to problem-solving. Basic->Intermediate technical/coding knowledge is assumed. If you like more info or source file to learn/use, or need more basic assistance, you may contact me at tanman1129 at hotmail dot com. To support this voluntary effort, you can donate via Paypal from the button in my Home page, or become a Patron via my Patreon site. A supporter/patron gets direct answers on any of my blogs including code/data/source files whenever possible. At the very least, it’ll encourage me to share more posts/tips/knowledge in the future. ▟