Just like most high-level programming languages, Python also supports the idea of classes. Once the class(es) is/are created they can be inside the main python file or separated (in most usage scenarios), along with it methods.
For Python-specific syntax, please refer to its documentation online or offline (python.org is a good start), but you should be familiar with basics of programming and classes, etc. to follow along here. This is not a ground-up tutorial on programming but basic enough to leverage your pre-existing knowledge to take it to newer heights.
Today, we will simulate a random-walk by a “rabid” racoon, as if it’s walking crazily all over the place, and we have a GPS tracker on it! The data we collect from the GPS, then will be used to plot a graph where we can easily see where it started, and ended up after several stops.
In this example, to keep things simple at first, we won’t be importing actual GPS data (I’ll show reading JSON, CSV and such real-world data files in future blogs), but will simulate the x,y coordinates for the racoon.
Most efficient way to do this is to create a Class of our own, so that we can reuse the code from any other program with variations. Let’s first create the Class, then the code to use it, and create graphs based on it.
The Class:
from random import *
class TakeAWalk():
 def __init__(self, num_points=500):
   self.num_points=num_points
   self.x=[0]
   self.y=[0]

def make_stops(self):
  while len(self.x) < self.num_points:
    x_direction = choice([1, -1])
    x_distance = choice([0,1,2,3,4]) # how far to move in x_direction. from 0 through 4 pixels.
    x_step = x_direction * x_distance;

    y_direction = choice([1, -1])
    y_distance = choice([0,1,2,3,4]) # how far to move in y_direction.
    y_step = y_direction * y_distance;

   next_x = self.x[-1] + x_step # [-1] picks the last/right-most value from the list.
   next_y = self.y[-1] + y_step

   self.x.append(next_x)
   self.y.append(next_y)
Explanation of the Class code:
We import the random module because we’ll be using its choice() function for simulating x,y directional values. The initialization sets the number of points to 500 as default. So, when we call to instantiate it, if no parameter is given, it’ll use 500, otherwise, it’ll use the value passed. init() is the function to create its object based on TakeAWalk().
It also contains a method called make_stops(). Its job is to calculate the x, y coordinate values, direction (left or right), and number of steps the racoon is going to take.
Notice, we pick a number just between 1 and -1 using choice(). There are many other ways to do it. But it’s a quick way to pick one of those two choices. 1 is right, -1 for left for x_direction var. Similarly, 1 for down, -1 for up for y_direction. Once the directions are set, we pick the distance on that x,y direction. The direction is simply set to be between 0 and 4 pixels (you can choose whatever you like). Then based on that, we choose the value for number of steps for x and y.
Ok, but we want to do this repeatedly for several ties (remember, 500 locations by default of whatever is passed to the class which is stored in num_points variable. So, we need to store multiple points. One way to do is to use Lists…or arrays for people like with C/C++/C#/Java/JavaScript background. One list for x, another for y. That’s why we initialized the x,y to [0] with self in __init__(). So, we start off with both zeros (NOTE the lists are numeric lists, you could use character lists, then you’d have to have convert them to numbers using int()). And we add to the list after every calculation of direction, steps using append() function. The local variables next_x, next_y are used in make_stops() method just to facilitate that easily. NOW, we wrap all this in a while loop inside the method! While…what? While should be for the num_points (remember, the number of stops/locations) passed to the class or using default 500 if nothing was passed.
Next Step With Class Code:
Now that it’s set, save it as a normal python file with extension .py. So, I’ll call it random_walk1.py and put it in your Python’s working directory (for simplicity, we won’t go into specifying other paths now). This concludes our creation of Class! Of course, the Class itself won’t do anything unless it’s called or instantiated by another piece of code.
Next Working Code:
So, now we’ll create a new code file (you can call it whatever, just make sure you call the above Class properly from it, noting the file name of the Class where you saved that) that’ll create an object based on the above class and call its method. Then, in your new code, you get the values returned and do whatever you want. In this case, we’ll plot a graph.
First, the new code will leverage the Class we created as follows:
from random_walk1 import TakeAWalk

tw=TakeAWalk()

tw.make_stops()
We imported the TakeAWalk Class from random_walk1.py file we created above. You don’t have to put “.py” in this statement, just the file-name part.
We created a new local object called tw by calling TakeAWalk() with default values. e.g. 500 points.
Then we call its method make_stops using the object. Now, we have access to the x,y parameters as defined in TakeAWalk!
Visualizing The Results…Plotting It!
To visualize, we will use Python’s matplotlib library. And use its scatter() method to create a scatter plot! The scatter() method takes x and y values for axes in the graph and optionally a size argument to define the size of the dots to be plotted.
So, in the same code, we need to add these lines…
import matplotlib.pyplot as plt

# plot the points from tw object
plt.scatter(tw.x, tw.y, s=15) # size of dot is 15

# plt.title(str(pts) +" Points Walked", fontsize=18) # set the title of graph to show the # of points

plt.title(str(tw.num_points) +" Points Walked", fontsize=18) # set the title of graph to show the # of points

# Optionally, I wanted to show the start and end points in different colors since it's hard to tell from graph those endpoints. So, we can add these lines:

plt.scatter(0,0, c='green', edgecolors='black', s=100, marker='>') # starting pt 0,0
plt.scatter(tw.x[-1],tw.y[-1], c='red', edgecolors='black', s=100, marker='+') # final point. [-1] gets the last value/right-most from the lists x[], y[] as stored in TakeAWalk object.

plt.show();
# NOTE: Everything starting with '#" above is a comment to describe the code only.
The show() renders the colored graph on a new window. The coloring, edgecolors, markers, title are all optional and for readability. Using pyplot module, we created a local variable plt to point to all the facilities in it for graphing.
The Output:
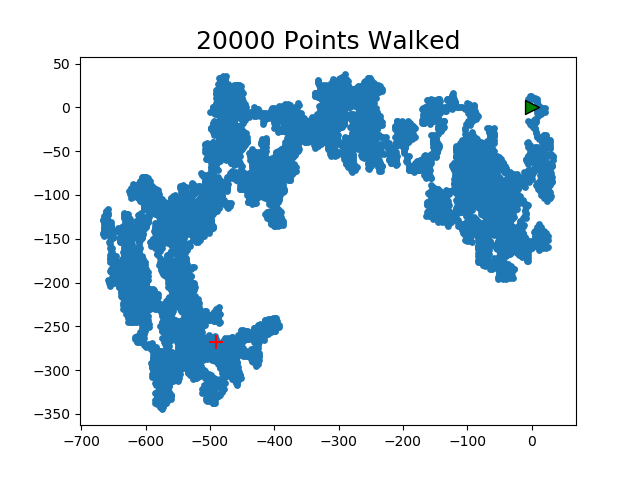
And here are some sample outputs using different number of num_points (i.e. stops) for the rabid racoon…
With TakeAWalk():
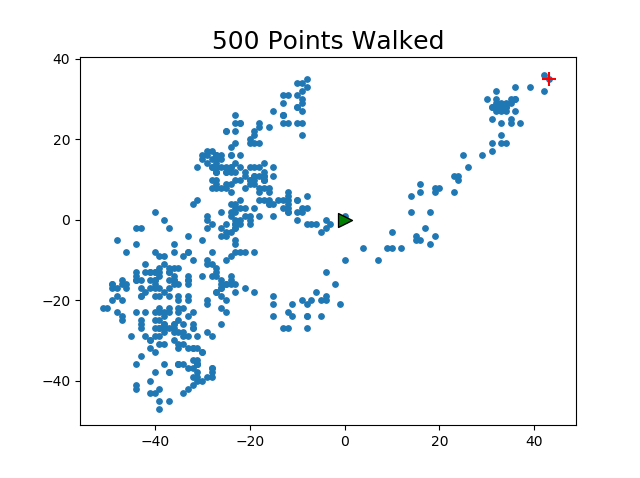
With TakeAWalk(20000):
NOTE: These are static graphs shown ONLY after the whole program has finished. Could we actually watch each point being plotted in real-time?
Yes, in the next blog, I demonstrate just that.