In this post, I share a method to utilize Machine Learning using Python. I have collected some data from CDC site about birth rate in the USA over several years. What I’d like to show you is how we can predict birth rate for a year that is NOT present in the dataset. For example, I want to predict birth rate for 2023. This is done first by training the computer with the CDC dataset, and then letting it compute the best predictable number for the queried year using the learning from the training dataset…specifically, I’ll be using Linear Regression model. Those familiar with Excel have done this and Excel also generates the regression formula based on the dataset. Same idea.
The dataset I downloaded is 42 data rows x 2 columns with headers: year,live births per 1000
datafile: livebirthratedata.csv (culled from full data set: CDC birthdata_1950-2018.xlsx )
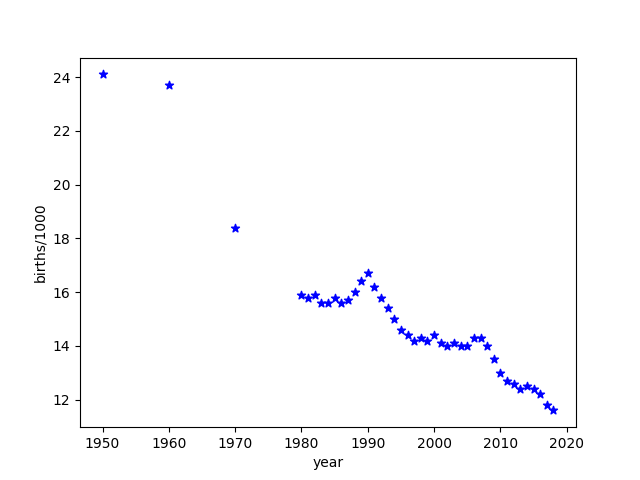
I then also draw a scatterplot using matplotlib. Before we dive into the code, let’s understand what the data means.
WHAT IS CRUDE BIRTH RATE?
The crude birth rate is the annual number of live births per 1,000 population.
CBR=(Number of births / total population at the time) * 1000
This calculation does not take migration or even age or genders into account. Hence the term “crude”. A crude birth rate of more than 30 per 1000 population is considered as high, while a rate of 18 or fewer is considered to be low.
Let’s take a look at some examples…
1) A city has a population of 1,000,000. 15,000 babies were born last year. What’s the crude birth rate?
Answer: 15
2) A city had a crude birth rate of 10 in a given year. That year, number of childbirths was 200. What was the estimated population at the time of the city?
Answer: 20,000
Okay, so that formula is simple enough but we’re solving a different type of problem here and won’t need that formula for machine learning. Instead we’re feeding the known data to the computer and letting it calculate the regression formula and apply it to whatever value we want. To do this, we will need a few libraries such scikit learn (sklearn). You can learn more about this library here. And we’ll need pandas for numpy array and matplotlib for chart (although not strictly needed for machine learning).
The rest is straightforward and the code is easy to follow as shown below. Once we have the regression object, we train the computer with the known data…this is “fitting” using regression.fit() method. After that’s done, we can use regression.predict() method to get our answer…e.g. crude birth rate in year 2023.
Here’s the source code…
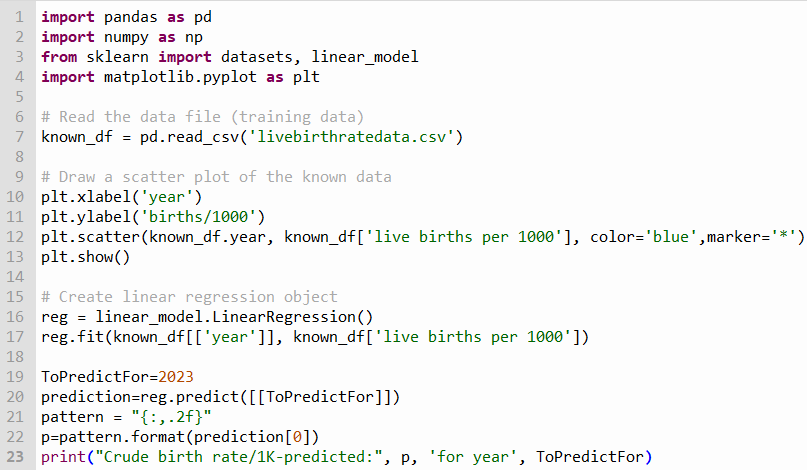
The chart it created looks like this:
And here’s the result:
    year  live births per 1000
39  2016                  12.2
40  2017                  11.8
41  2018                  11.6
[10.77082448]
Crude birth rate/1K-predicted: 10.77 for year 2023
It’s saying there will be about 11 births per 1000 people in the USA in year 2023. Of course, this is based on regression model and not crystal ball method, so it’s using math instead of prophecy 🙂 and therefore could be different from actual results in the future.
We used prediction on a single variable in this example: the year. This is univariate regression. In the next blog, I share how to use Multivariate Regression model where we make the computer predict something based on several criteria.
▛Interested in creating programmable, cool electronic gadgets? Give my newest book on Arduino a try: Hello Arduino!
▟