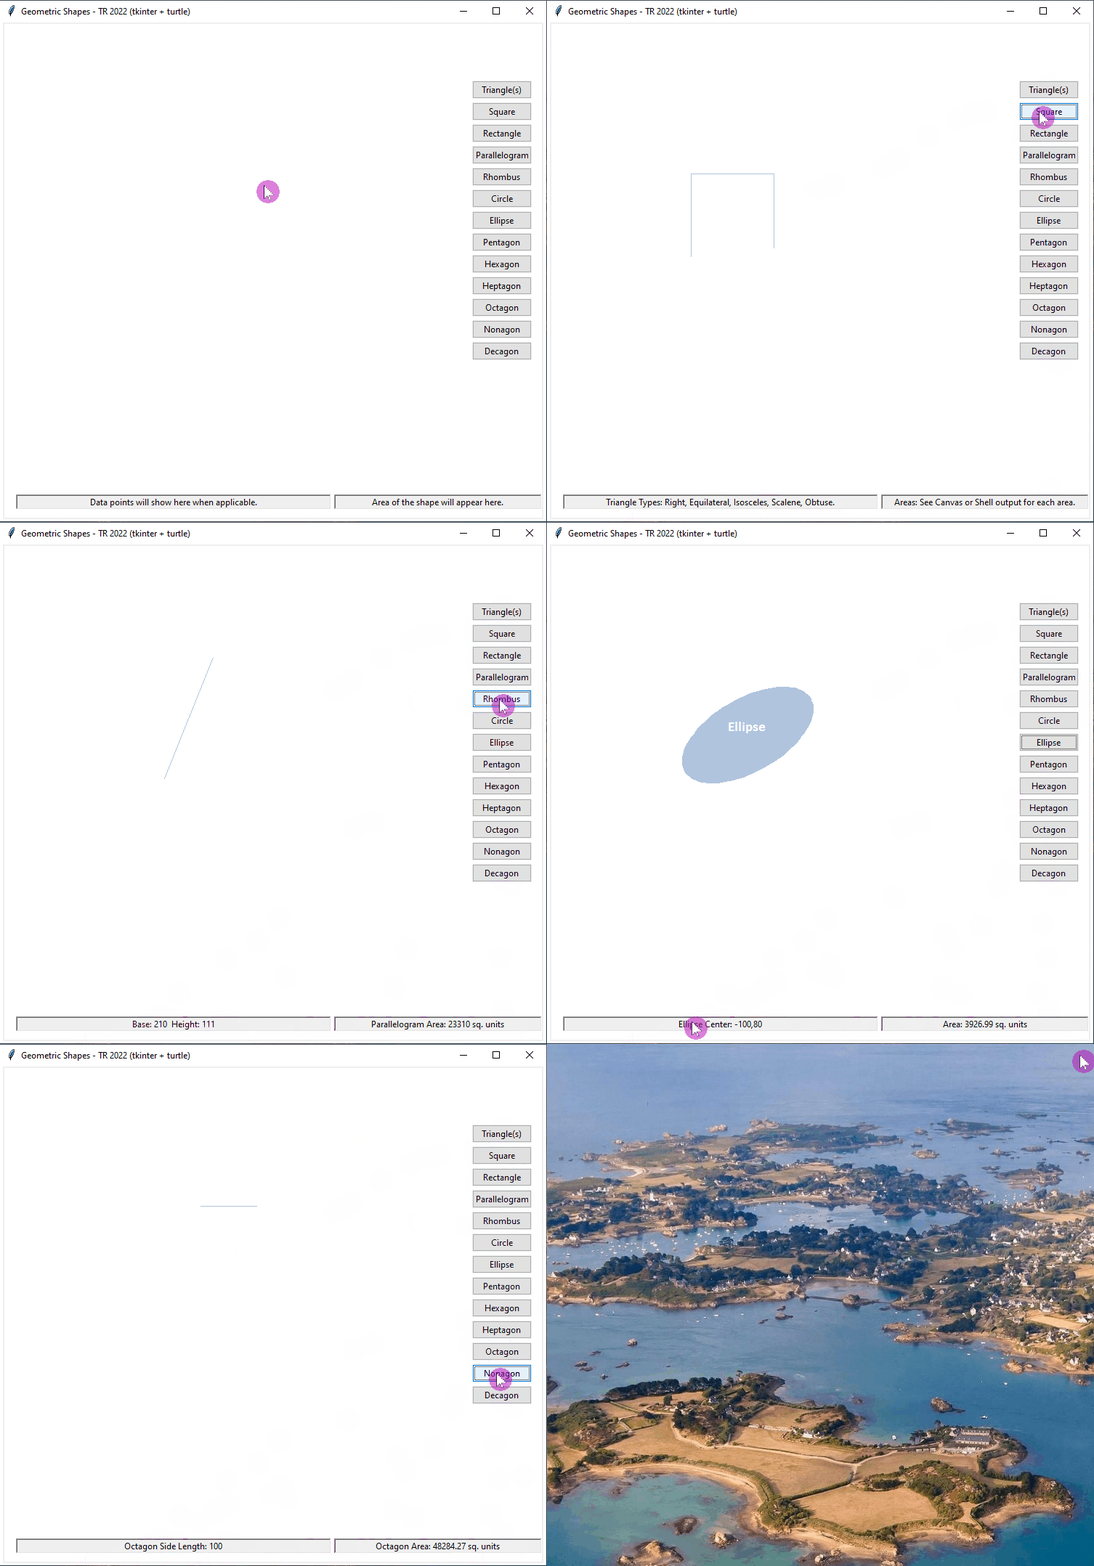
In this post, I’m sharing a complete Python program that draws various geometric shapes on screen with given parameters (e.g. side length, radius, height, tilt, etc.). The application is downloadable here and can be executed on a Windows device (tested on Windows 10). The download will be a ZIP file called tkinter-drawgeometricshapes.zip —copy or unzip the tkinter-drawgeometricshapes.exe file inside it and just double-click the exe file to run it. An animated session of the program is shown below.

I won’t share the entire source code here (it’s about 900 lines) but will touch on a few key concepts and anatomy of the application.
To accomplish, I used 2 key libraries: tkinter and turtle, and a module from tkinter called ttk. I created the buttons, application window, and status bar using tkinter library and to draw I used turtle with animation so we can see the actual drawing of each shape real-time. A critical thing to point out is that tkinter uses a completely different coordinate system than turtle (it’s 0,0 is at center of the canvas/screen and x,y increase just like you’d expect in a graph paper); where tkinter’s is more like the most of the programming platform where 0,0 is the top-left corner of the window.
Each button is tied to a function that does the necessary computation of the area of the shape, drawing on screen, and updating both screen and status bar information. Each shape drawing is actually done with turtle…as their coordinate systems are vastly different, we have to be careful about the layout and positioning. The key to making both libraries work together is using RawTurtle() instead of the usual Turtle() function as I learned.
The formulas for each shapes are from known mathematical formulas as taught in school.
The polygon shapes are regular shapes, meaning their sides are assumed to be same regardless of the number of sides…except the triangles where I intentionally draw different types of triangles including those where the sides are not equal (obtuse, scalene, right, etc.). Most of the polygon drawings are then mapped to my custom function that handles when to draw a parallelogram vs rectangle vs square. For example, the following maps the event handlers for Square button to my function drawFourPointedShape() function passing the starting x,y coordinates (where to start drawing on screen), and the x,y coordinates of each vertex:
sqrpoints=[122,70, 122,184, 236,184, 236,70]
btnUI=ttk.Button(root, width=12, text="Square", command=lambda:drawFourPointedShape(-300,-50, sqrpoints,1))
The rest of the more complex polygons (pentagon…decadon) are mapped to handles as follows:
btnUI=ttk.Button(root, width=12, text="Pentagon", command=lambda:drawComplexPolygonTurtle(-100,150, 5,100)) The circle and ellipse are different beasts, they take starting coordinates where to start drawing on screen, and then radius, and for ellipse the tilt (angle in degrees), the centroid coordinates, width and height of the ellipse as it can be any shape. Based on the width, height and the centroid of the ellipse, I have to calculate where to start drawing so that it fits in the window. This is done by:
x = cx + w*math.cos(t)*math.cos(math.radians(tilt))-h*math.sin(t)*math.sin(math.radians(tilt))
    y = cy + w*math.cos(t)*math.sin(math.radians(tilt))+h*math.sin(t)*math.cos(math.radians(tilt))
# where cx,cy is the center of ellipse. w,h are width and height in pixels.
# tilt is the skewness of the ellipse in degrees. These are passed to my function
# by the button handlers.
Based on the width and height, we can then calculate the area using π * hr * vr formula where hr and vr are horizontal radius and vertical radius.
My complex polygon handler is made flexible enough to tackle 6 different polygon shapes instead of writing 6 different functions. It takes starting point coordinates, number of sides in polygon (e.g. 6 for hexagon), and length of each side. To update the status bar with correct name, and also correctly compute areas (each one’s area formula is different), I map the number sides with it label using a dictionary as follows (there are many other ways I could have done it, but I felt it’s a great use-case for a dictionary object):
polygondict ={
      5: "Pentagon",
      6: "Hexagon",
      7: "Heptagon",
      8: "Octagon",
      9: "Nonagon",
      10: "Decagon"
    }

# Then later, simply get the associated label name by:
slabel = polygondict.get(sidenum)
NOTE that the coordinates are passed to these functions internally, however, I have another application posted earlier about how to read coordinates from an external file/source…you can search for tag Python on this site to find that example. So, these coordinates can from anywhere and don’t need to hard-coded.
As I said, there’s a lot more going on here in this 900-line script and I’m only calling out some points here. The areas for each shape, for reference, are as follows (I had to dust off several books/resources to find some of them):
Ellipse: π * a * b [where a, b are major and minor axes respectively]
Circle: π * r^2
Heptagon: 7/4 * s^2 * cot(180°/7) [where s is side length]
Hexagon: s^2 * (3 *sqrt(3))/2
Nonagon: (9/4)* s^2 * cot(π/9)
Octagon: s^2* 2(1+ sqrt(2))
Parallelogram, rectangle, square: b * h [b:base, h: height]
Pentagon: (5s^2) / (4tan(36º))
Rhombus: 1/2 * (b * h)
Equilateral triangle: (sqrt(3)/4) * s^2
Right, Isosceles triangles: 1/2 * (b * h)
Rest of triangle shapes: = ABS(Ax (By – Cy) + Bx (Cy – Ay) + Cx (Ay – By)) / 2 [where A,B,C are the vertices and their coordinates suffixes]
I had a lot of fun creating this as I was learning the ropes the UI on turtle and tkinter myself. I hope it was somewhat educational for you.
▛Interested in creating programmable, cool electronic gadgets? Give my newest book on Arduino a try: Hello Arduino!
▟