Indeed, “Climate change” has been the hot topic for the last couple of weeks. It even surpassed the hubbub around the pandemic the world is experiencing for the past 2 years and counting! Thanks to COP26…the gathering of the “relevant” world leaders to discuss top, pressing issues of the world, the list of which contains climate at the very top.
This got me thinking about how to easily converse about carbon footprint without too much nerdy mumbo jumbo. Besides, I always believe if you can’t explain it simply, you don’t understand it well enough. And if people cannot relate fairly easily to issues, they simply won’t care!
So, without going into politics (you may satiate political needs from many other sources), let’s jump right into understanding the basics of what is known in many forms such as “carbon footprint”, “carbon emission”, “CO2 emission”, “climate impact”, etc. I don’t claim to be an expert on the topic by any means, simply, I was curious as to how generally they’re calculated, if there are standardized formulas, and obtain some data from credible sources, and see if I can explain it simply. I will also convert all units to units we use everyday in the United States. Here, people don’t use “litre”, “pint”, “metric ton”, and “kg” much in daily lives…people can readily relate to gallons, sometimes “liters” (notice the spelling difference from “litre”), and tons (technically “short tons”) and pounds (lbs).
I collected some basic information from various sources such as US Energy Information Administration (EIA), EnerGuide (Brussels), WebsiteCarbon.com, Business, Energy and Industrial Strategy (BEIS), BBC and some others that is the basis of my calculations by scenarios below.
Jet/Plane travel: What is the carbon footprint of private jet travel?
Planes emit carbon dioxide (CO2) from burning fuel which contribute to global warming. The longer the burn-> more CO2 is emitted-> worse for the environment. Simple as that. How much CO2 is emitted depends on the distance travelled of course, type of fuel used, and also the type of plane.
Recently, many world leaders flew on their own private jets from Rome to Glasgow to discuss climate change at COP26 summit. They are public servants but they don’t use public transporation and they fly first-class on their own private jets without sharing the ride with the commoners. That’s just what they do. Not sure if they’re masters or the servants, but we’ll mull over it another time. So, the flight from Rome to Glasgow takes about 2 hours and 45 minutes. A modern, efficient, and most popular private jet in use is Cessna Citation XLS (you can buy one here for about $4,000,000), which is a medium jet that can carry maximum of 8 to 9 passengers (+2 crew members).
It burns about 189 gallons/hour. So, each one-way trip burned 520 gallons of aviation fuel. I also found that 2.52kg of carbon dioxide is emitted for every litre of fuel. Meaning 26.21 lbs of CO2 are emitted per gallon of fuel. Meaning 13622.6475 lbs or 6.8 tons of CO2 were emitted per one-way trip per plane! There were LOTS of trips for the COP26 was to discuss ways to reduce CO2 emission (beacause each important delegation wanted to be flown in their own jet plane). Assuming even the maximum capacity of 9 passengers packed into each plane (seriously doubtful), each of them were responsible for 0.76 tons of CO2 emission to the summit.
However, planes also has additional climate impact due to them flying at high altitude where other non-CO2 emissions occur, so the BEIS recommends multiplying the CO2 emission by 1.9 to reflect the total effect. So, we are now at 12.92 tons of climate emissions for each Rome->Glasgow trip.
Let’s get back to earth with the “commoners” now…
Car travel: What is the carbon footprint of driving?
Per EIA, there is 18.74 lbs of CO2 emission per gallon of gasoline. Obviously, the further you go on a gallon the lower the footprint and that’s dependent on the type of vehicle (we’re not discussing electric vehicles) are some metrics I can reasonably use are:
20 miles/gal combined city/hwy avg for SUVs. Not hybrid.
37 miles/gal combined city/hwy avg for best-performing sedans. Not hybrid.
50 miles/gal combined city/hwy avg for best-performing sedans. Hybrid.
Example: If I drive a generic car for 12000 miles per year. Mostly single occupant. What’s my CO2 emission?
We can 18.74 as the emission coefficient for a generic car here, which yields the answer: 5.62 tons of CO2 emitted per year by that car (driven 12,000 miles).
Now, if I carpooled with 2 passengers (3 occupants), the per-person CO2 emission would go down to: 1.87 lbs per year. So, you might feel a little better myself individually although the car would still emit the same amount of CO2 to the environment if I drove alone or 2 more people! However, if those 2 more people also drove individually, then we can see the cumulative effect to the environment…that’s why car-pooling is encouraged in most cities.
For more CO2 emission coefficients, see EIA site.
We have to talk about computer usage!
Computer usage: What is the carbon footprint of typical computing?
According to EngerGuide (Brussels), a well-equipped desktop uses an average of 200 Watts/hour when it is being used (speakers, router, printer, and typical peripherals included). It also states 176 kg of CO2 emission for 600,000 Wh.
Here, instead of travel time we are concerned with how long the computer is ON.
In summary, at 8 hours/day active usage, the desktop will emit 388 lbs of CO2 (or 176 kg) OVER A YEAR
Note that putting the monitor on stand-by reduces its consumption by 15%. Putting the whole computer in hibernation mode (desktop or laptop), power consumption (Wh) is 1/3rd of its normal usage. Also note that a laptop power usage is about 50% or sometimes even 25% of a desktop’s.
Crypto Footprint?
Bitcoin has been traditionally using primarily fossil fuels for mining. If the price hypothetically reached $500,000 it would emit 680126078 million tons (US/short tons) of CO2 annually. (source). However, that is the worst-case scenario where 100% non-renewable source used. In reality, there are already many alternatives and we’re beginning to see the shift not just by Bitcoin but by most other cryptos using renewable energy sources such as solar, wind, hydro, nuclear, and we expect that trend to continue (to move away from fossil fuels).
Finally, what about the Internet?
Well, the internet is a large forest of websites, which run on servers, which require electricity. Not all websites are equal nor are how electric power is generated for the servers and data centers. We do know for sure that data centers, transmission networks, and all the edge devices require a LOT of electricity to keep the Internet running 24/7 around the world. Just like your device, a web site will require more electricity if it has to use more computing power on images, layouts, codes, fonts, etc. Remember: Efficient coding and frameworks are not just better for performance, but also reduces CO2 emissions.
A test on my blog site (this) shows that 0.21 grams of CO2 is produced every time someone hits it. Meaning, this web site is cleaner than 85% of web pages tested (source: www.websitecarbon.com: An average web page tested produces 1.76 grams).
At the time of writing, my website probably gets maximum of 3,000 monthly page views, which would translate to 7560 grams or 16.7 lbs per YEAR. To compare, an “average” website with the same number of page views would emit 36 lbs of CO2. But keep in mind 3,000 monthly hits is tiny compared to what’s going on out there elsewhere! Which brings us to some heavy-hitters.
Google.com for example gets about 5.6 billion hits a DAY, or 2 trillion searches per year! (source: SEOTribunal.com) That is 3,880,135,814 lbs of CO2 emission annually (3 BILLION POUNDS).
Google has made it carbon commitment public…on its home page, the footer link “Carbon neutral since 2007” takes you to more information about their “CARBON COMMITMENTS”:
“…by 2030, we’ll operate on carbon-free energy, everywhere, 24/7.” and “We’ll replenish 120% of the water we consume by 2030”.
Microsoft has made similar commitments as well. On its climate page they plan to be carbon NEGATIVE (yes, not just neutral!), and water POSITIVE by 2030. They also have a link to their progress report on the page.
With the hope that these commitments will materialize and our Earth will continue to be cleansed incrementally by humans, and with the hope that you have gained some basic understanding of how emissions are calculated today (it can change in the future) and get a quick overview of common carbon sources, I leave you to find out your own carbon footprint—until next time!
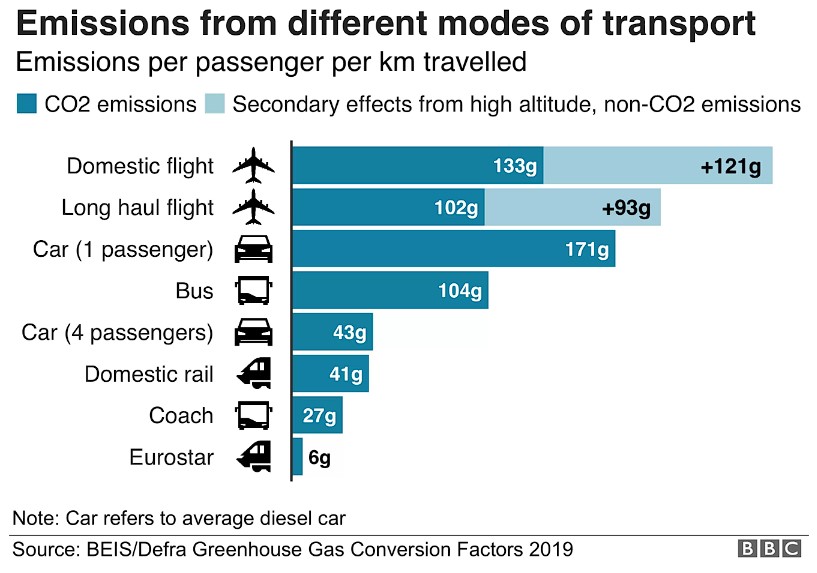
Here is the latest (2023) CO2 emissions data per passenger on various vehicles:
Interested in creating programmable, cool electronic gadgets? Give my newest book on Arduino a try: Hello Arduino! 