In this post, I’ll show how to write a program that reads x,y coordinates for a complex shape (Polygon) from an external source. Then recreate the shape on a canvas with some interactivity. The application’s action clip is below:
In the above clip, I’m reading datafiles that contain the coordinates as a series of contiguous coordinates for x and y, each value separated by a comma. e.g. 101.8,116,33.6,98,29.6,27.6,101.8,3.6,136.6,62,……and so on.
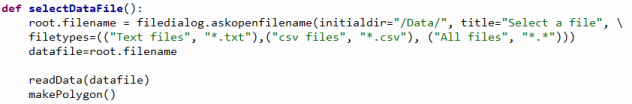
The filedialog.askopenfilename() method is used to allow user to browse to any folder to select the datafile. I also specify the extensions allowed in the fileopen dialog: txt, csv, or simply all types, and also with the method I set the initial directory that’ll be opened by the dialog making it extremely easy to locate and select a file.
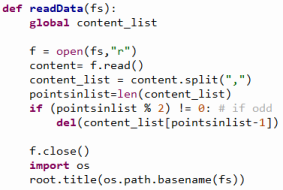
Once a file is selected my custom function readData() does work of parsing the content, handling errant data in datafile—since a 2D point must be made of at x, y pair, after parsing out the comma and loading each number as an element in memory, the number of elements must be an even number, otherwise we have an extra character at end such as an extra comma, CR, etc.
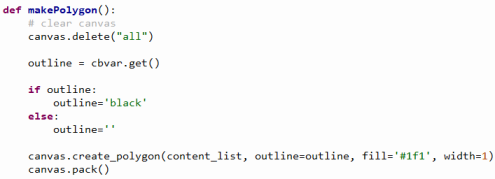
Next, I call my custom function makePolygon() that handles the canvas drawing part using create_polygon() method from tkinter library.
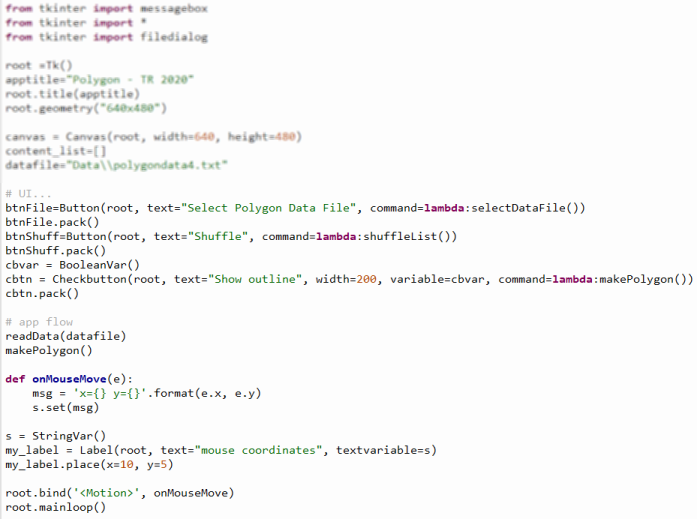
I also show the actual x,y screen coordinates of the mouse as we move the mouse as well on screen…this actually helps to compare the drawn points read from datafile with actual mouse points for verification. This is done by binding mouse Motion to my custom function onMouseMove() where I can capture its x,y values at any time and do whatever I need to do with them.
A boolean type variable cbvar keeps track of if checkbox Outline is checked or not.
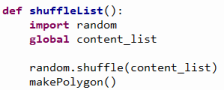
Shuffle reorders x and y pairs randomly for fun to see how Polygon function handles them!
The complete code for each of my functions are below:
The overall app flow is then below (the slightly blurred part is just my tkinter setup code):
In the next related post, I’ll show how to create or generate the polygon data using your mouse. That application generates all the polygon data easily and saves them to a file, while this app reads that file back and draws all the points on screen! That post is linked below:
▛ This post is not meant to be a formal tutorial, instead it is to offer key concepts, and approaches to problem-solving. Basic->Intermediate technical/coding knowledge is assumed. If you like more info or source file to learn/use, or need more basic assistance, you may contact me at tanman1129 at hotmail dot com. To support this voluntary effort, you can donate via Paypal from the button in my Home page, or become a Patron via my Patreon site. A supporter/patron gets direct answers on any of my blogs including code/data/source files whenever possible. At the very least, it’ll encourage me to share more posts/tips/knowledge in the future. ▟