Love em or hate em, New England Patriots is a team to reckon with. They’ve implemented numerous creative and suspicious internal strategies that most other teams would love to copy or at least understand. Well, I cannot expose those details as they’re not available anywhere. What is available however is their scores and stats. So, I will get last 10 years worth of their stats and see what we can glean from that. If you’re interested in NFL stats across the league, you may also want to take a look at my older blog: NFL 2019 Regular Season Is Done. What Have We Learned?
Data Extraction and Transformation
First off, I got the data per year from pro-football-reference.com. Each sheet contained the regular season’s data. Then I combined all into a single sheet and transformed them using Power Query. Then after some more clean-up, conditional formatting, and custom formula columns, I have 160 rows (16 games over 10 years) and 23 fields. Something like below with each year clustered together continuing through 2019 season.

Note here the blue columns. They are added by me for my own analysis (which can be derived from the downloaded stats). e.g. FinalScore Differential, End3rdQtr Diff (This is to see what the score differential was at the end of 3rd quarter), Penalties Diff (this is the yards differential in penalties suffered by Patriots vs the opponent in each of 160 games), 4th Q Pts Diff (this is to see how many Patriots scored in 4th Q and how many the opponents did, regardless of win/loss), converting Home/Away games from letters (H/A) to numbers (for quantification in some charts), Win/Loss (W/L) from letters to numbers, and a couple of others such as “Unusual game” (definition will be explained below).
The Takeaways
So, after all those data churning, what have I learned? Lots of interesting facts. I won’t explain all of them here, nor in too much details, but a quick summary for the sake of brevity. I’ll share mostly visuals but when the numbers are more interesting, I’ll share them as “cards” below.
Win-Loss-Tie: Over 10 years, they won 78% of all games. A winning team! There were 0 tied games. 6 games went to OT or 4% over 10 years.
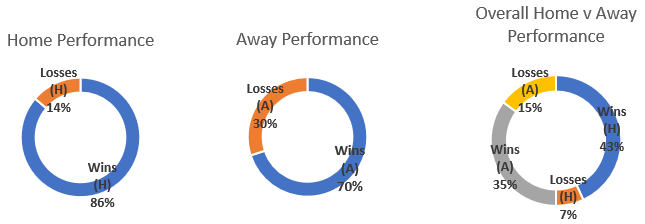
Home-Away Performance: They lost 11 games at Home (out of 80 played at home)…clearly plays to home-advantage. And they won more games than lost when Away (out of 80 played away). When we look at it over 160 games (instead of 80 @home, 80 @away), we get the right-most chart below.
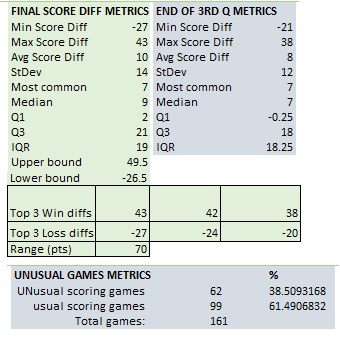
Scores and Unusual Games:“Unusual” game is defined by me as when the score differential is either greater than 1.5 times the sum of Average Score Differential + Standard Deviation of scores, or less than 1.5 times the difference of Standard Deviation and Average Score Differential.
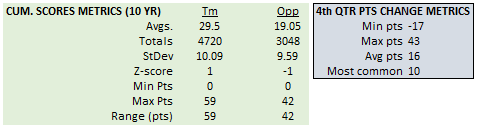 Tm: is Patriots (“Team”). Opp: Opponent team. Note the Z-score points to the fact that this is a winning team (even we lived under a rock and didn’t know anything about Patriots or the sport). In the points change metrics card, positive number is better for the team (Patriots)…most often they put up 10 more points in the 4th Q (since end of 3rd Q).
Correlation: Do we find any correlation between winning the game and a few selected factors as below?
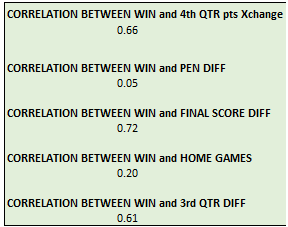 We see that their chance of winning the game is reasonably related to the points exchange or differential in the last quarter. Interestingly penalties don’t seem to bother them much! In fact, we’ll take a deeper look at this later as it seems quite unique for this team.
There’s a very good chance that whenever the team is leading at the end of 3rd Q, Pats will win the game. Although, they’re heavily favored (by results) at home, because they had been so strong @away games that the correlation of a W and whether it’s a Home or Away is favoring toward Home but not severely.
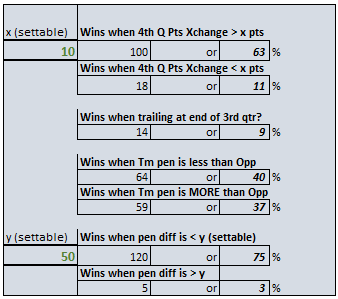
Now let’s take a deeper look at penalties…the table below in my worksheet allows us to input any number (shown in green numbers) in the cells and it’ll tell you the percentage of wins (for both greater than the input value and less than the input value). This is NOT a prediction, this is a formulated lookup from past 10 years of data. For example, the following table shows that when Pats had +10 points differential in 4th Q (+10 meaning Pats were up by 10), 63% of the time they won the game. When it was less than 10 points, the winning % dips to only 11%. It also shows that penalty differential is +50 yards, they actually win! This seems counter-intuitive to most teams. Pats actually often won more games where they had more penalties than the opponents! (NOTE: positive differential in penalty yards is BAD for the team. Negative penalty differential is GOOD…you want to have less penalty yards than opponents. This is not the count of penalties, rather yards penalized).
When there’s no/little penalty differential (y=~0), the win/loss chance is about 50-50. Most wins 78% occured when the penality diff >=+80 (i.e. Pats were 80 yards more penalized than opponent!). Penalty differential within [+/-]5 yds makes NO difference in Win/loss for Pats.
My theory is that they play more aggressively, making more aggressive/questionable plays that can result in huge gains (and ultimate wins) and sometimes in large penalties.
In-between there are additional parameters you see that I can play with to get the outcomes (I won’t go into describing them all as you get the idea).
Let’s a take a look at some “visuals”…
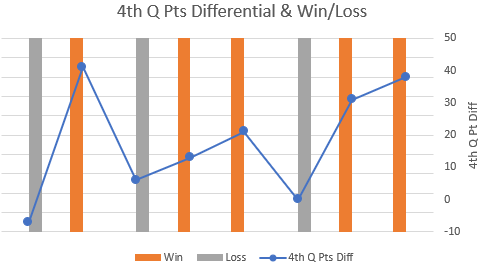 This is pointing to the fact that every time the higher 4th Q points differential was high, they won for 10 years.
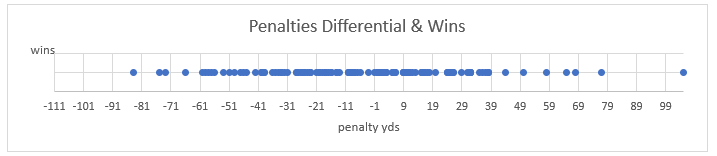
The following strip chart shows each Win with a blue dot with the corresponding penalty differentials in yards (negative means, Pats had less penalty yards against them than the opponent…good thing). As it becomes apparent here also (in addition to the numbers previously) is that they’re spread out with no obvious advantage (in terms of a W) for having less penalty yards…at least for Pats!
Trends: Let’s take a look at how penalties for/against Pats (and its opponents) have been trending over time. And also the scoring patterns of Pats (and its opponents) over 10 years.
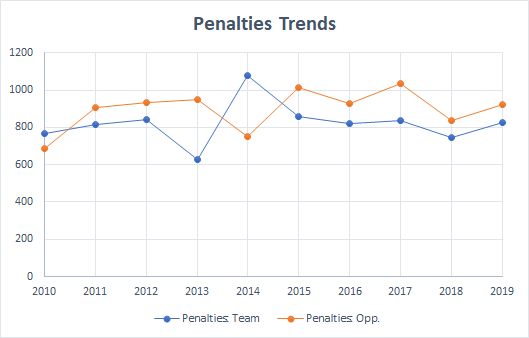 Notice that in 2013, Pats were very little penalized relatively, and the following year they were penalized the most in 10 years! This is most likely the symptom of NFL make-up calls where they most likely were criticized after 2013 season and went to over-correct the following year 🙂 Lately however the trend seems fair and balanced.
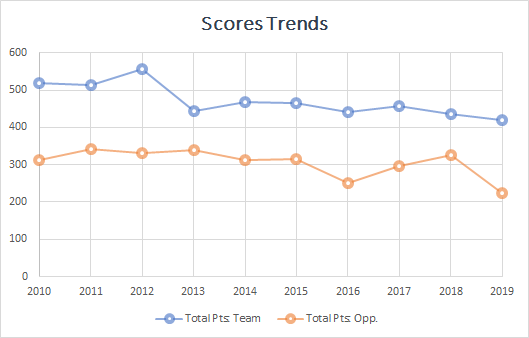 Notice the general drop of scored points. This is most likely the effect of NFL rule changes since 2010.
Of course, I could go on and on just based on these exciting data set. We can create pivot tables and slicers to find complex patterns and inter-dependencies. Hope this was fun and interesting to read for you 🙂
If you like more info or actual source file to learn/use, contact me via this form or directly by emailing me at trseattle at outlook dot com. To support this voluntary work, you can also donate via the Home page.