You’ve just been delivered some raw transactional data from a new salon owner, who’s very optimistic about her new business but also cautious. She wants to understand her customers, patterns during the day and week so she can adjust her prices, staffing, scheduling, stocking, and more.
Your objective: Based on the raw transaction records dump, analyze the data to see which days of the week are busiest/slowest, what types of payments are most/least common, which services are most/least common with which type of customers and on which days, and more.
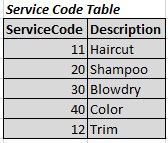
Use the Service Code table to translate service code to service descriptions for reporting.
Solution: The steps involved will be: clean and structure the raw data -> pivot the data -> provide visual cues and add interactivity/flexibility to view data from various perspectives.
Raw Data:
Here is a snapshot of the data you have. Unfortunately, the data dump is a long text for each day. You added the headers in order just to understand the order of data.
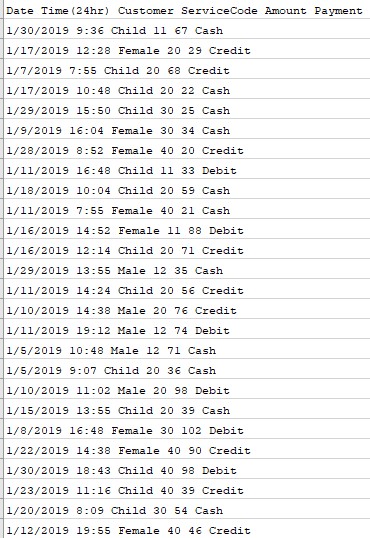
You’ve also found the code table to translate the service code into a descriptive name.
That’s a good start. Next step is to structure the data and do some “translation”. You notice that there spaces in-between the fields or words on each line. So you paste the raw data into a spreadsheet (e.g. Excel) and clean that up using SPACE [char(32)] as the delimiter and turn them from Text to Columns.
Then you need to format the date appropriately because you’ll need to perform some math on them to extract weekdays/weekends. Also, you want to perform math on time to translate them into AM or PM. The raw data is in 24-hour format.
Of course, for transaction amounts, you want to change the Amount column to numeric.
You sheet should look something like this:
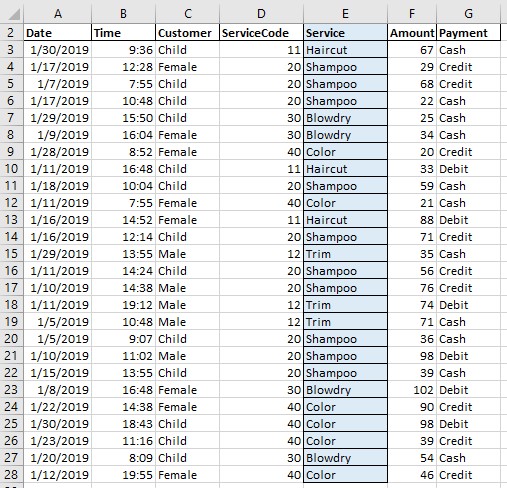
The blue column Service is calculated and you insert a new column and do a lookup using the Service Code Table as mentioned earlier. You have inserted that data in a separate sheet, and you can pull in the description of each service from that table using ServiceCode value. In this case, you can do this via VLOOKUP or XLOOKUP. I used XLOOKUP here because I can look left or right of the lookup value. Assuming that your sheet is named “rawdata” where the code table resides in a range of C4 to D8, the formula is: XLOOKUP(D3,rawdata!$C$4:$C$8,rawdata!$D$4:$D$8)
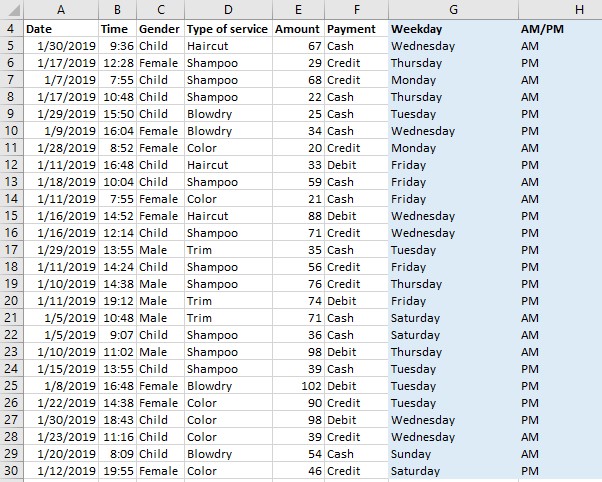
Next, you want to insert new columns for Weekday name and time of the day—specifically AM or PM.
Now that column A is formatted as date, extracting the weekday is really easy in Excel using TEXT(cell, “dddd”) for each cell of A.
The AM/PM column takes more thought. And the logic I used is to split the day into half so that if it falls after the first half of the day, I’ll call it “PM”, otherwise “AM”. The formula becomes IF(MOD(cell,1)>=0.5,”PM”,”AM”) where cell is B5, B6…and so on.
Now, you have everything you need and in the way you need! All you have to do now is focus on pivoting the data and adding interactivity.
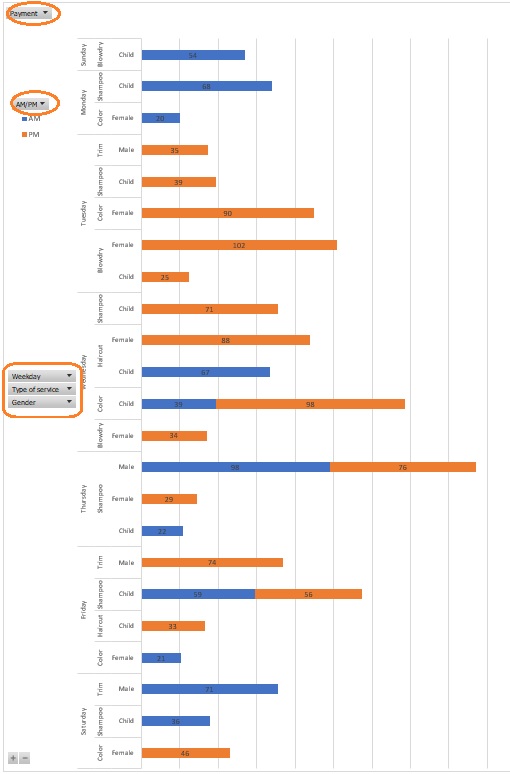
First, you add a pivot table with the filters shown below and you also add a pivot chart next to it (or in another sheet/workbook, doesn’t matter). They look something like below:
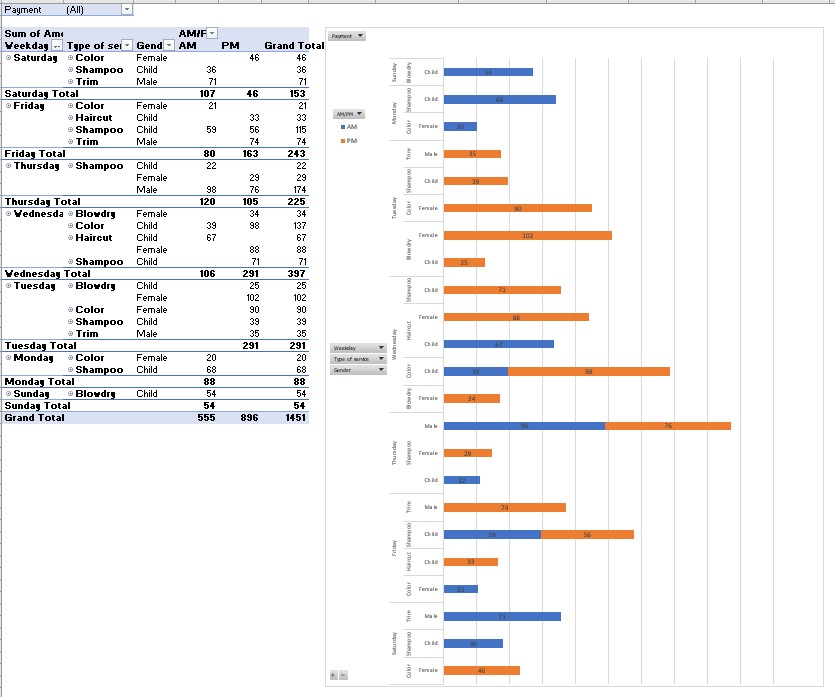
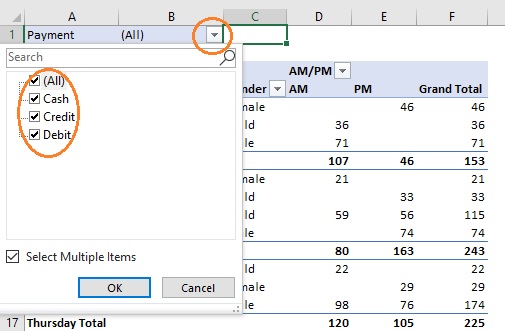
Zooming into specific portions, you can see you can filter by Payment (added as a report filter):
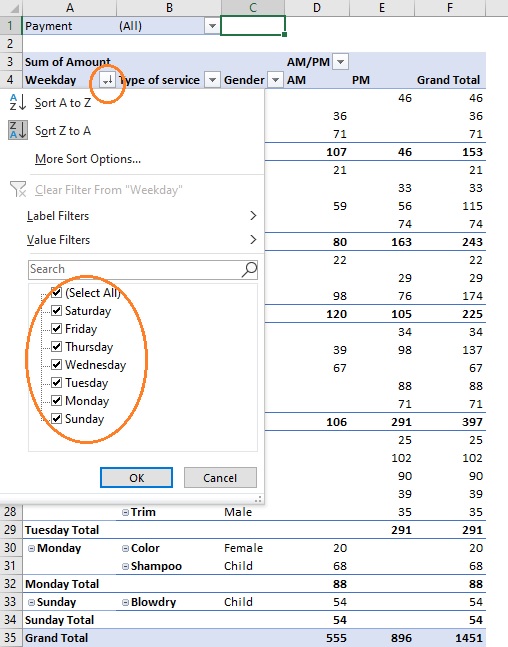
You can also sort/select (one or more/all) weekdays. All numbers update exactly according to your selections.
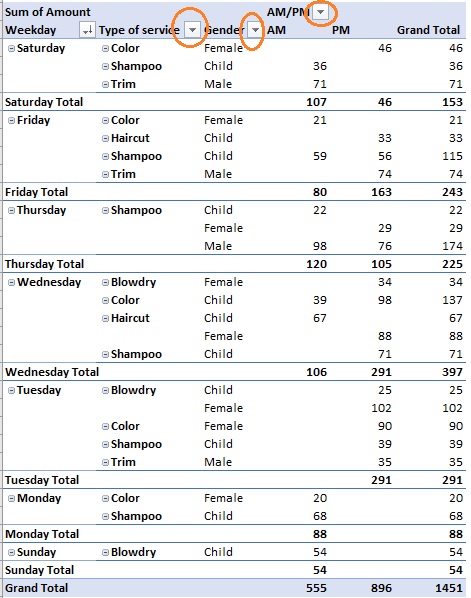
Similarly, you can look at each type of service and their revenues, the customer category/gender, time (AM/PM) and you can mix and match them to answer complex questions like: How much color did I do on weekends for female customers? Or, which day and time are busiest and what services are most popular? And how are customers paying for the services…how much cash do I need for my till?
Since you’ve also created a chart, you can visually compare the volumes for any of the selections for your perspectives.
That’s what pivots are best at! We could write formula after formula for each possible question we could think of separately and put in the answers in separate tables and such, or we could do this! It allows us to ask many questions at any given time without having to hard-code many formulas. The only time we used formulas is to clean and structure the data. While we only used here about a week’s worth of data, what if it was 100,000 records? Because of the way we approached it, it’ll take about the same time (just a few minutes for operations to complete) as if it was 10 records…that’s the beauty of proper planning and then automation.