Here I touch on a quick but effective way to do forecasting based on historical data…this without the help of any chart.
Scenario
You have data on your customers’ spends at your shopping mall based on how many miles they drive to get there. The dataset is below. Your objective is to find out how much you’d expect a customer to spend when she’s driven 8 miles.
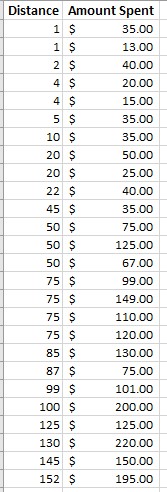
As you can see the distance of 8 miles isn’t something you have exact data on; therefore you’ll need to forecast for that situation.
We can achieve this by using linear forecasting formula in Excel: FORECAST.LINEAR()
By feeding it the parameters, 8 for x, known ys from the dataset’s spends, and known xs for the known distances, we get the answer: $31.46
Let’s do another scenario…
Scenario
You have some data on your sales for several quarters as: 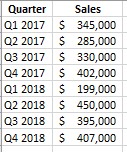
Your objective is to predict Q1, Q2, Q3, Q4 sales figures for 2019.
We can feed the forecast function again but before we do this we need turn the quarters into some meaninful numbers that Excel can use in the statistical function. Looking at the dataset, it’s clear the “Q1 2017” is a starting period and “Q4 2018” is the ending period of our data. So, if we arrange them properly and feed the periods as known xs and ys as the sales, then we can find the x which is we’re after, the periods: 9 through 12!
The answer then should as this:
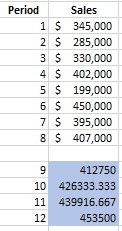
Format the results as you wish. And now you’re a hero manager 🙂
Real-life Example (Golden State Warriors scores) 
Let’s see how this forecasting holds up against a random real-life scenario. I just happened to pick a basketball team Warriors, and I want to do a forecasting for the next 11 games based on previous 24 games results. Specifically, I want to predict the number of wins and losses, points differential for each game, points scored for the team (PF), and points scored against them (PA).
From Google’s NBA page, I found the scores from 10/5/19 through 12/20/19.
Let’s start with the first 24 games, and we’ll predict the next 11 games using the technique above, and then we’ll compare our results with actual results of those 11 games. Good?
Here’s my dataset for 24 games: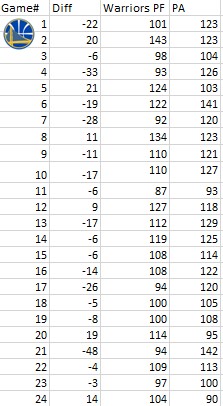
(only Diff column is calculated)
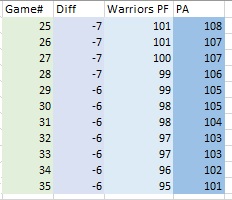
Next, I use the linear forecasting to predict games 25 through 35 as follows. All blue cells (any hue) below are calculated via forecasting formula:
Let’s Compare
Here’s the actual results-table also from the Google site: 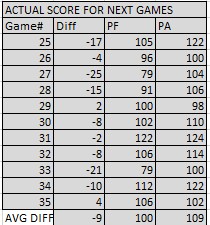 and I calculated the averages for each column to compare with my prediction.
Observations
- PREDICATION 1: We predicted they’d lose the next 11 games by 6 to 7 points in each overall (Diff).
- ACTUAL: The actual scores show they actually lost 9 of 11 games by an average of 9 points.
- PREDICATION 2 : We predicted they’d score 98 points/game on average.
- ACTUAL: The actual is 100.
- PREDICATION 3: We predicated the opponents would score 105 points/game on average.
- ACTUAL: Opponents scored 109 points/game on average.
The Verdict
Given that we didn’t even consider the opponent teams strengths, playerchanges/situations, game strategy, location, etc. and many other complex factors, it’s still amazingly close!
You could start betting on horses 😉